

What if market crashes aren’t mainly about bad news but about people copying each other?
When enough investors stop thinking and follow the crowd, small moves become a wave that drives prices sharply down.
This post breaks down the psychology and market mechanics behind that wave: why we copy, how panic selling, stop-loss orders (automatic sell rules), and margin calls (when brokers demand more cash) amplify it, and what simple signs to watch before the crowd heads for the exits.
You’ll get clear, practical signals to help avoid panicked selling and keep a steadier plan.
Core Explanation of Herd-Driven Market Crashes

Herd behavior causes crashes through a straightforward chain: when enough investors ditch their own research and just copy the crowd, buying and selling gets synchronized. Individual choices pile up into something much bigger. A wave.
Panic selling starts when the first movers head for the exits. Others notice and follow. Prices drop, which pulls in more sellers. The cycle feeds itself until prices collapse and the whole system locks up.
Herding happens when you watch what everyone else is doing and decide their moves must be smarter than whatever you figured out on your own. Early choices build momentum that later players can’t ignore, even when their own data points somewhere else.
Panic selling turns into full crashes because each wave makes the next one stronger. Prices fall, fear spreads through headlines and social feeds and trading desks. Investors who planned to hold start worrying they’ll be the last one stuck. Liquidity disappears. Buyers step back to wait things out, and sellers face wider spreads or no bids at all. Feedback loops tighten everything: falling prices trigger more fear, which produces more selling, which confirms the fear. The loop doesn’t break until exhaustion sets in, someone intervenes, or a credible signal shows the worst is over.
Major historical crashes show the same pattern. The 1929 stock market collapse saw masses of regular people and pros rushing to sell as confidence evaporated. The dot-com bubble around 2000 inflated on euphoria for internet stocks and deflated just as fast when optimism flipped. The 2008 crisis mixed housing market herding with cross-market contagion, and the COVID-19 crash in early 2020 showed how quickly global sentiment can sync up when uncertainty spikes.
Key mechanisms that turn herd behavior into crashes:
- Information cascades – early moves create a signal that later movers follow, even when their private info says otherwise.
- Panic selling – fear-driven exits pile up and speed up price drops.
- Liquidity evaporation – buyers vanish, leaving sellers with no one on the other side and spreads that keep widening.
- Sentiment contagion – emotions and stories spread fast through networks, aligning behavior.
- Feedback loops – selling lowers prices, which justifies more selling, creating a spiral that feeds itself.
Behavioral Drivers Behind Herding and Crash Formation

Fear of missing out and loss aversion are two powerful forces behind synchronized investor choices. FOMO pushes buyers into rising markets because watching others profit feels worse than the risk of overpaying. Loss aversion works in reverse during downturns. The dread of losing money you’ve already put in overwhelms the logic of holding through volatility, so you sell to stop the psychological pain. Panic compounds both. When uncertainty spikes and prices fall sharply, a lot of people shift from thinking things through to just reacting. And that reaction tends to be identical: get out now.
Herding can be informational and rational, or it can be irrational and driven purely by social pressure. Informational herding happens when you genuinely believe others know something useful and you copy their choice to grab that insight. Early adopters might have better data or expertise, so following them can be a shortcut when you’re uncertain. Social herding occurs when people mimic the group simply because everyone else is doing it, without any real information edge. This type cranks up instability because it disconnects choices from fundamentals and creates volatility that feeds on itself.
Professional fund managers and analysts face career incentives that make herding attractive even when they have private doubts. A manager who underperforms peers risks losing clients and reputation. But a manager who fails alongside the entire industry can point to systemic factors beyond individual control. Benchmarking against indexes or peer portfolios creates safety in numbers: buying the same stocks as competitors protects against career risk. That logic makes sense at the individual level but gets dangerous at the system level, because it means pros pile into the same trades and exit together, amplifying booms and busts instead of smoothing them.
Market Mechanisms That Turn Herd Behavior Into Systemic Crashes

Liquidity dries up fast during herd-driven selling because market depth collapses. Under normal conditions, the order book has layers of bids at gradually lower prices, so you can sell without moving the market much. When herding starts, those layers vanish. Buyers step back, waiting for clarity or a floor, and the remaining bids sit way below the last traded price. Sellers who need to exit face a choice: accept a steep discount or wait and risk worse. Many choose to sell immediately, which removes even more liquidity and pushes prices lower. The feedback accelerates because thin markets amplify every transaction.
Stop-loss orders and algorithmic trading systems can trigger cascades that sync up selling across thousands of participants without any human deciding anything in real time. A lot of investors set automatic sell orders at predetermined price levels to limit losses. When the market falls to those levels, the stop-loss orders execute all at once, creating a surge of selling that drives prices through the next layer of stops. High-frequency algorithms detect the flow, join the selling to profit from short-term momentum, and the combined wave overwhelms buyers. The result is a sudden, sharp drop that looks coordinated but is actually just the mechanical sum of individual rules firing at the same time.
Margin calls and forced liquidation spread declines across assets and markets. Leveraged investors borrow money to amplify returns, but when their positions lose value, brokers demand more cash. If you can’t meet the call, the broker sells your positions to cover the loan. During a crash, margin calls hit many accounts at once, forcing sales of whatever is liquid, not just the stuff that triggered the call. That means losses in one sector (tech stocks, for example) can force sales in another (bonds, commodities, real estate), spreading the decline and creating correlations that don’t exist in calm periods.
Cross-market contagion happens when selling in one asset class or geography triggers herding in others, raising systemic risk. Investors who face losses or redemptions in one market often sell holdings in unrelated markets to raise cash, and the fear that drove the first market down spreads through news and trader networks. Correlation spikes during crises because the question shifts from “what is this asset worth?” to “do I need to get out now?” That shift turns diversified portfolios into synchronized portfolios, and the sell-off goes global even when the original shock was local.
| Mechanism | Effect During Crashes | Example |
|---|---|---|
| Liquidity evaporation | Bid-ask spreads widen sharply, market depth vanishes, prices gap down | March 2020 Treasury market disruption |
| Stop-loss cascades | Automatic sell orders execute in waves, creating sudden sharp declines | Flash crash events, circuit-breaker triggers |
| Margin calls and forced sales | Leveraged positions unwind, spreading losses across asset classes | Long-Term Capital Management collapse 1998 |
| Cross-market contagion | Selling in one market spreads to others, correlation spikes, diversification fails | 2008 synchronized global equity declines |
Historical Case Studies Demonstrating Herd Behavior’s Role in Market Crashes
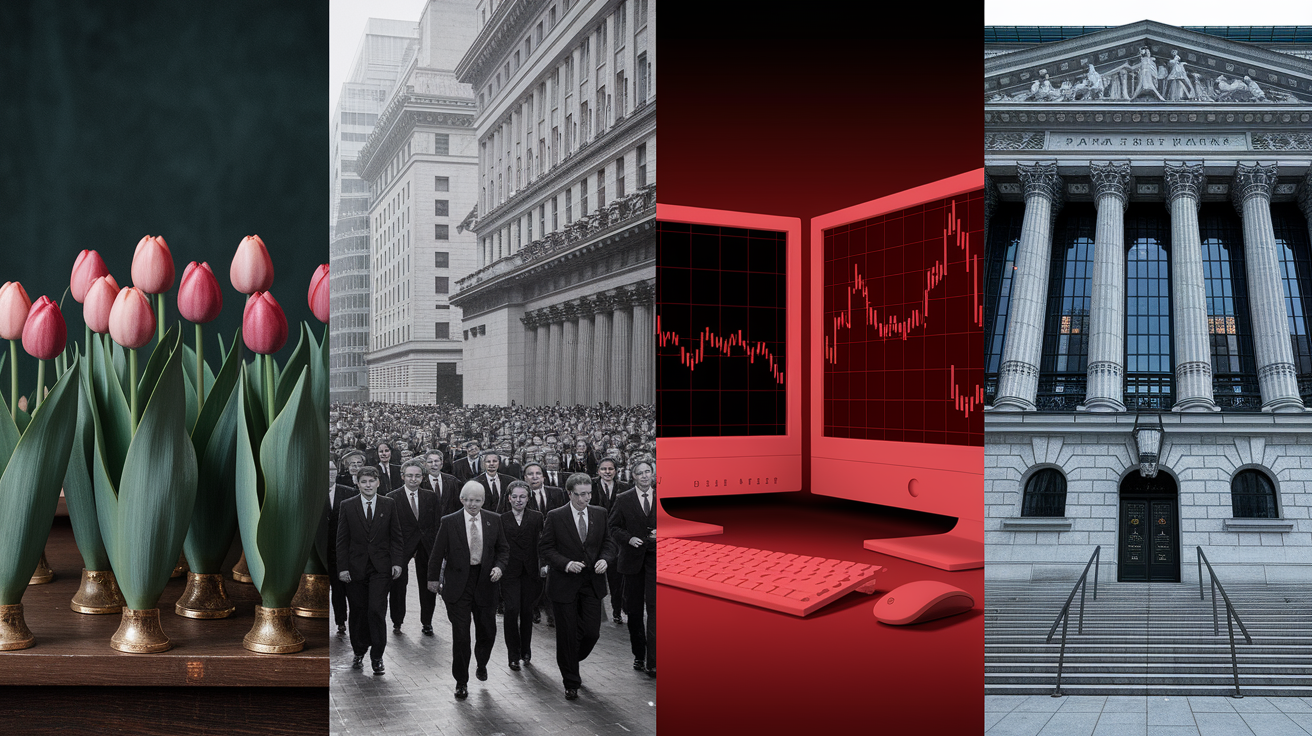
Tulip Mania in the Netherlands around 1637 and the 1929 stock market crash stand as early, vivid examples of speculative herding. Tulip bulbs became status symbols, and prices climbed as buyers competed to own rare varieties, each convinced the next buyer would pay more. When doubt crept in, the herd reversed instantly. Prices collapsed to a fraction of their peaks within weeks. The 1929 crash followed a similar script: ordinary Americans and professionals borrowed heavily to buy stocks through the 1920s boom, driven by the belief that prices would rise forever. When selling began in late October 1929, panic spread, margin calls forced liquidations, and the market lost nearly half its value in months.
The dot-com bubble around 2000 showed how technology hype and network effects can amplify herding in a new sector. Investors piled into internet stocks with little or no earnings, convinced that traditional valuation no longer mattered. Venture capital, retail day-traders, and institutional funds all chased the same momentum. When skepticism returned and a few high-profile companies missed targets, selling began, and the herd that had bought on optimism exited just as quickly. The NASDAQ lost roughly 75 percent of its value from peak to trough, wiping out trillions in paper wealth.
The 2008 crisis combined housing market herding with complex financial engineering and cross-market contagion. Lenders, investors, and rating agencies collectively bet that US housing prices would keep rising, so mortgages to risky borrowers got packaged into securities and sold worldwide. When housing prices fell and defaults spiked, the value of those securities collapsed. Panic spread through investment banks, money markets, and global equity markets. Lehman Brothers filed for bankruptcy on September 15, 2008. Forced selling, frozen credit markets, and fear drove stock indexes down by 50 percent or more in many countries, showing how herd behavior in one asset class can cascade into a systemic financial collapse.
The COVID-19 market crash in early 2020 illustrated the speed and global reach of modern herding under uncertainty. Between March 1, 2020 and March 13, 2020, Foreign Portfolio Investors withdrew 247.76 billion rupees from Indian equity markets and 140.50 billion rupees from Indian debt markets, driven by fear of pandemic impacts before most lockdowns had even begun. Similar patterns played out in Europe, the Americas, and Asia. Investors fled to cash and government bonds, equity volatility spiked to levels unseen since 2008, and central banks intervened with unprecedented liquidity programs to halt the spiral.
Key herd-driven features visible across these episodes:
- Rapid price inflation fueled by optimism and FOMO, disconnected from fundamentals.
- Sudden reversal when doubt spreads, triggering synchronized selling.
- Feedback loops where falling prices validate fear and accelerate exits.
- Liquidity collapse as buyers vanish and bid-ask spreads widen.
- Forced selling via margin calls, redemptions, or regulatory constraints.
- Cross-market and cross-border contagion spreading the decline globally.
How Information Cascades Amplify Herd Behavior and Trigger Crashes

Information cascades happen when early movers’ choices carry so much weight that later participants abandon their own signals and just follow. In theory, if you see two people in a row make the same choice (both invest in the same asset, for instance), you might reasonably infer they each had positive private information. Even if your own research suggests caution, the apparent consensus can seem more reliable than a single data point. Once that logic takes hold across many participants, a cascade forms. Everyone watches everyone else, and private information stops flowing into prices. The market locks onto a path that might be wrong, but self-reinforces because no one wants to bet against the visible consensus.
Cascades are especially dangerous because they can be based on incorrect early signals and still persist. Imagine the first investor makes a choice based on a noisy or mistaken signal, and the second investor, seeing the first, decides to follow. The third investor sees two in a row and follows, even though her private information contradicts the choice. By the fourth or fifth decision, the cascade is entrenched, and the market has moved far from the fundamentals. Reversing the cascade requires a shock strong enough to break the social proof, which often means a large, sudden loss that forces participants to re-evaluate. That reversal is typically when the crash happens.
Cascade Conditions in Sequential Models
A widely cited formal model of herding uses a Bayesian game with n investors choosing sequentially among k assets. Each investor receives a private signal about which asset is best, and the accuracy of that signal is drawn from a uniform distribution on the interval from 0 to 1. Investors are risk-neutral and want to pick the correct asset, but they also observe the choices of everyone who decided before them. If the first two investors choose the same asset, the model shows that later investors often find it optimal to follow, ignoring their own signals entirely. The cascade can lock in an incorrect choice if early signals happen to point the wrong way or if an uninformed player moves before a well-informed one. The conditions for incorrect cascades include low signal precision, sequential visibility of choices, and a small number of early movers establishing a perceived consensus before enough independent information enters the system.
Cross-Market Contagion and Global Spillover Effects of Herding
Cross-market contagion occurs when herd behavior in one financial market spills over into others, linking assets and geographies that would otherwise move independently. During calm periods, correlations between markets reflect fundamental economic ties, like trade relationships or shared industries. During crises, those correlations spike because the dominant force is no longer fundamentals but fear and liquidity needs. Investors who face margin calls or redemptions in one market sell holdings in another to raise cash, and the selling pressure spreads. Media coverage and real-time feeds amplify the effect. A crash headline in New York triggers pre-emptive selling in Tokyo and London before local trading even opens.
Empirical studies document this pattern. One widely cited 2010 study found evidence of contagion from a dominant market to stock markets in Brazil, Chile, Mexico, China, and Hong Kong, showing that emerging markets herd toward movements in major developed markets during periods of stress. The mechanism is partly rational (major markets do carry information about global growth and risk appetite), but the speed and scale of the response suggest herding rather than measured re-assessment. Investors in smaller markets watch the dominant market closely and assume its moves reflect superior information or unavoidable trends, so they align their portfolios even when local conditions differ. That behavior breaks the diversification benefit. A portfolio spread across continents still suffers synchronized losses when herding drives global correlation near one.
Correlation spikes create systemic risk because they turn isolated shocks into widespread crises. A problem that starts in subprime mortgages in the United States becomes a banking crisis in Europe, a currency collapse in emerging markets, and a commodity sell-off in resource exporters, all within weeks. The financial system is built on the assumption that risks are dispersed and failures are local, but herding violates that assumption. When everyone tries to exit the same position at the same time, there’s no natural buyer, and prices fall until forced sellers capitulate or authorities intervene. The result is a system-wide liquidity freeze and a crash that no single participant intended but all contributed to.
Four types of spillovers driven by cross-market herding:
- Equity spillovers – stock index declines in one country trigger selling in others.
- Debt market spillovers – rising sovereign or corporate bond yields spread across borders.
- Derivatives and leverage spillovers – margin calls and collateral calls force simultaneous asset sales globally.
- Sentiment spillovers – fear and pessimism spread through news and social networks, synchronizing behavior before economic fundamentals change.
Empirical Evidence and Measurement of Herd Behavior in Crashes

Empirical studies of herding show mixed results across markets, time periods, and methods, highlighting both the reality of the phenomenon and the difficulty of measuring it cleanly. A 2005 study found no evidence of herding in Chinese stock markets, but later research around 2007 and 2008 found the opposite, suggesting that herding can be episodic and sensitive to market conditions or regulatory changes. A 2011 examination of four southern European markets found strong herding in Greece and Italy, mixed evidence in Portugal, and none in Spain, even though these countries share geographic proximity and many economic characteristics. The variation suggests that local investor composition, transparency, and institutional factors matter as much as broad psychological tendencies.
A 2014 cross-country study of European markets reported that herding was statistically insignificant during normal times but became pronounced during the crisis years and the Eurozone crisis. That finding aligns with theory: stress and uncertainty increase the value investors place on observing others, and liquidity pressures force rapid choices that favor copying visible trades over independent analysis. A separate 2015 analysis of Central and Eastern European markets from 2003 to 2013 found evidence of herding in 4 out of 10 countries, again illustrating geographic and temporal inconsistency. A 2017 sector-focused study documented herding in the US financial industry, though some findings suggest that herding among commercial and investment banks may be largely spurious, driven by common exposure to regulatory changes and macroeconomic shocks rather than intentional imitation.
Measurement challenges complicate interpretation. Most herding tests rely on clustering of portfolio choices or deviations from equilibrium dispersion, but those measures struggle to distinguish spurious herding (common response to shared information) from intentional herding (ignoring private signals to copy others). Researchers typically can’t observe the private information each investor held or the counterfactual outcome if that information had been acted upon. Detected herding might reflect rational updating in response to credible signals, or it might reflect irrational conformity. The distinction matters for policy: rational herding can be efficient and doesn’t necessarily require intervention, while irrational herding increases volatility and systemic risk.
Sentiment indicators and volatility measures offer indirect evidence. Spikes in fear indexes (like equity volatility indexes), sudden jumps in trading volume, and rapid correlation increases across assets all suggest herd dynamics at work. During the early weeks of the COVID-19 pandemic, sentiment indicators spiked globally within days, and cross-asset correlations rose sharply, consistent with widespread panic and synchronized selling. Those patterns support the hypothesis that herding drives crashes, even when formal tests on individual portfolio data yield ambiguous results.
Mitigation Strategies to Reduce Herd-Driven Crash Risk

Regulatory and structural protections can slow or interrupt herding cascades before they become systemic crashes. Transparency and disclosure requirements reduce information asymmetry, which lowers the perceived value of simply copying others and encourages investors to rely on publicly available data. A 2019 study found that greater transparency tends to reduce herd effects, confirming the intuition that uncertainty fuels imitation. Circuit breakers and trading halts provide a cooling-off period during rapid declines, giving participants time to process information and breaking the mechanical feedback of stop-loss cascades. Macro-prudential policies, like limits on leverage and stress testing of large institutions, reduce the likelihood that margin calls and forced liquidations will amplify small shocks into large crises.
Portfolio-level techniques help individual investors resist herd pressure and protect capital. Diversification across asset classes, geographies, and strategies reduces exposure to any single market’s herding episode, though diversification benefits shrink during crises when correlations spike. Rules-based investment plans, like fixed rebalancing schedules or dollar-cost averaging, automate choices and remove the emotional temptation to follow the crowd. Thoughtful stop-loss design can limit downside without triggering panic exits: setting stops based on fundamental thresholds or volatility bands rather than arbitrary price levels reduces the chance of selling into a temporary cascade. Independent analysis and pre-commitment to investment theses create psychological anchors that make it easier to hold through periods when the herd is moving the other way.
Behavioral countermeasures focus on reducing the cognitive and emotional triggers that drive herding. Investor education that explains feedback loops, liquidity risks, and the history of crashes can inoculate against panic by framing volatility as normal rather than catastrophic. Limiting exposure to real-time price feeds and news during high-stress periods reduces the social proof effect and the temptation to react to every headline. Building checklists and decision protocols before a crisis forces deliberate thinking and slows the shift from analysis to reflex. Recognizing career incentives in professional settings allows institutions to design compensation and evaluation systems that reward independent judgment and long-term performance rather than short-term peer conformity.
Five core strategies to mitigate herd-driven crash risk:
- Enhance transparency and disclosure to reduce reliance on observing others’ choices.
- Implement circuit breakers and trading pauses to interrupt mechanical cascades.
- Adopt rules-based investment plans that automate choices and resist emotional pressure.
- Diversify intelligently across assets and strategies, acknowledging correlation risk during stress.
- Educate and pre-commit using checklists, protocols, and historical context to anchor decisions when fear spreads.
Final Words
Mass psychology drives synchronized moves: copying others, panic selling, price falls, and then systemic crashes. We explained herding, feedback loops, liquidity drying up, and gave historical examples.
We showed the psychology, like FOMO, loss aversion, reputational pressure, and the market mechanics—stop-loss cascades, margin calls, and cross-market contagion. We also covered ways to reduce risk: disclosure, circuit breakers, and steady portfolio rules.
Understanding how herd behavior causes market crashes lets you build a calmer, simpler plan and stay steady when others panic.
FAQ
Q: How does herd mentality affect investing?
A: The herd mentality affects investing by pushing people to copy others, which synchronizes buys or sells, amplifies price moves, fuels panic selling, and can help create bubbles or sudden market crashes.
Q: Who owns 88% of the stock market in the USA?
A: Eighty-eight percent of the stock market in the USA is owned roughly by the wealthiest 10% of households, who hold most equity through direct shares, mutual funds, and retirement accounts.
Q: What is the 7% rule in stock trading?
A: The 7% rule in stock trading typically means closing a position if it falls about 7% to limit losses; it’s a flexible guideline, not a guarantee, and should match your plan and risk tolerance.
Q: Why do 90% of people lose money in the stock market?
A: Ninety percent of people lose money in the stock market because of poor timing, trading too often, using leverage, high costs, emotional choices, and lacking a long-term plan; rules and diversification help.
