

Think stocks are only for price gains? Dividend funds turn stock payouts into steady cash you can use now or reinvest for more growth.
They pool money to buy dividend-paying stocks and bonds, collect the cash those companies send, and hand it to you as regular distributions.
This post shows how dividend funds work, the main types, from high-yield to dividend-growth and international, and the simple checks to pick one that matches your income needs and risk comfort.
Understanding How Dividend Funds Work and What They Offer

Dividend funds are mutual funds or ETFs that buy securities paying regular cash. These funds pool investor money to build portfolios of dividend stocks, interest-paying bonds, or both. The goal? Ongoing income through distributions plus potential price appreciation down the road. Equity dividend funds usually show trailing twelve-month yields between 1.5 percent and 4.5 percent, while bond-focused income funds often yield 3 percent to 7 percent depending on what they hold.
Most dividend funds pay quarterly, though some go monthly or annually. The fund collects dividends and interest from its holdings, subtracts expenses, and passes the net income to you as a distribution. Two yield numbers help you compare income potential. TTM yield adds up the last four quarters of distributions and divides by the current share price. SEC yield uses a standardized thirty-day calculation, giving you a forward estimate of annual income. Both can shift as holdings change and share prices move.
Dividend funds spread your risk across dozens or hundreds of individual securities. A dividend cut from one company has less impact than it would if you owned just that stock. That matters because dividends aren’t guaranteed. During the 2020 pandemic, sixty-eight S&P 500 companies suspended or reduced their payouts. Even established firms sometimes trim dividends during downturns. Costs also matter for long-term returns. Passive dividend ETFs often charge between 0.03 percent and 0.10 percent per year, while actively managed dividend mutual funds typically range from 0.30 percent to 1.00 percent or higher.
How dividend funds operate in practice:
- Income source: Funds collect quarterly dividends from stocks or interest from bonds, subtract operating expenses, and distribute the balance to shareholders.
- Distribution timing: Most equity dividend funds pay quarterly. Some bond income funds and international dividend funds pay monthly to smooth cash flow.
- Ex-dividend date: The fund sets an ex-dividend date each quarter. You must own shares before that date to receive the next distribution.
- Reinvestment option: Many brokerage accounts let you automatically buy more shares with each distribution, compounding your returns without lifting a finger.
- Yield variability: A fund’s yield moves when holdings change their dividends or when the fund’s share price rises or falls. Yield isn’t locked in like a bond coupon.
- Fee impact: An extra 0.50 percent annual expense ratio on a ten thousand dollar holding costs fifty dollars per year and compounds negatively over decades.
Key Types of Dividend Funds and Their Income Strategies

Dividend funds come in several flavors, each built around a different income philosophy and risk profile. High-yield dividend funds chase the largest current payouts. Dividend-growth funds favor companies that steadily raise distributions year after year. International dividend funds look beyond U.S. borders for income and diversification. Specialty strategies add layers like covered-call premiums or preferred-stock interest to boost cash flow. Understanding the distinctions helps you match a fund to your income needs, time horizon, and tolerance for volatility.
High-Yield Dividend Funds
High-yield dividend funds target stocks with above-average current yields, often in the 3 percent to 5 percent range or higher. These portfolios typically hold between fifty and one hundred fifty names and lean heavily into sectors known for cash distributions: financials, utilities, energy, and consumer staples. A fund tracking high-yield names might favor mature companies with stable but slower growth, trading future expansion for income today. The appeal is straightforward. More cash in your account each quarter. The trade-off is that high yields sometimes signal weak growth prospects or elevated risk. Companies under financial stress may maintain a high dividend temporarily while profits decline, setting up a potential cut. Screening for payout ratios well below 100 percent and solid balance sheets helps separate sustainable high yields from yield traps. Expense ratios for passive high-yield dividend ETFs often sit near 0.06 percent, while active versions may charge 0.30 percent to 0.50 percent for stock selection and sector timing.
Dividend-Growth Funds
Dividend-growth funds prioritize companies that increase their payouts year after year, even if the starting yield is modest. These funds commonly show current yields around 1.5 percent to 2.0 percent because share prices tend to be higher when a company reliably grows its dividend. The power of dividend growth shows up over time as reinvested distributions buy more shares and as annual income rises without needing to invest additional cash. A stock that raises its dividend 6 percent per year will double its payout in roughly twelve years, turning a 2 percent starting yield into 4 percent on your original cost. Dividend-growth portfolios usually hold one hundred fifty to two hundred stocks and spread across more sectors than high-yield funds, including technology and healthcare names that reinvest profits for expansion but still share some cash with shareholders. These funds work well for younger investors building wealth through reinvestment and for retirees who want income that keeps pace with inflation over a long retirement.
International and Specialty Dividend Funds
International dividend funds invest in dividend-paying stocks outside the United States, offering geographic diversification and access to markets with different dividend cultures. Developed-market international dividend ETFs might hold three hundred fifty stocks from Europe, Japan, Canada, and other stable economies, with yields often near 2.2 percent. Emerging-markets high-yield dividend funds concentrate in faster-growing but more volatile countries like China, Taiwan, and Brazil, where yields can reach 4.0 percent to 4.5 percent but dividends fluctuate more with local economic cycles and currency swings. Specialty income funds add non-traditional strategies on top of dividends. Preferred-stock income funds buy hybrid securities that pay fixed dividends like bonds but trade on stock exchanges. Yields often range from 4 percent to 6 percent with less price volatility than common stocks. Covered-call income funds hold dividend stocks and sell call options against them, collecting option premiums to boost income above the dividend yield alone. These strategies can add one to three percentage points of extra yield but cap upside if stock prices rally sharply.
Evaluating Dividend Funds Using Yield, Fees, and Holdings Data

Choosing a dividend fund requires comparing a handful of metrics that reveal income quality, cost efficiency, diversification, and risk concentration. Start with yield measures to estimate the cash you’ll receive, then check expense ratios because even small fee differences compound over decades. Review the number of holdings and sector weights to see how much concentration risk you’re taking on. Finally, look at payout and turnover ratios to gauge sustainability and potential tax bills. Together these data points tell you whether a fund delivers stable income at a reasonable cost or hides risks beneath an attractive headline yield.
TTM yield shows the income the fund paid over the trailing twelve months divided by its current share price, giving a backward-looking snapshot of what investors actually received. SEC yield uses a standardized thirty-day calculation and adjusts for expenses, offering a forward estimate of annual income if the fund’s holdings and expense ratio stay constant. Comparing both helps you spot trends. If TTM yield is much higher than SEC yield, recent distributions may have included one-time capital gains or special dividends that won’t repeat. If SEC yield is higher, the fund may have recently raised distributions or cut costs. Expense ratios matter because they come straight out of returns every year. A fund charging 0.06 percent costs six dollars annually on a ten thousand dollar investment, while a fund at 0.50 percent costs fifty dollars. Over thirty years, that extra 0.44 percent shaves thousands of dollars off your ending balance through compounding.
Holdings count and sector concentration show how diversified the fund really is. A fund holding three hundred to four hundred dividend stocks spreads risk widely. A single dividend cut barely moves the portfolio yield. A fund with sixty to one hundred twenty names gives the manager room to pick high-conviction ideas but amplifies the impact of any one company suspending its payout. Sector weights reveal hidden bets. Dividend funds often tilt heavily toward financials, utilities, consumer staples, and energy because those industries generate steady cash and distribute it to shareholders. A fund with 40 percent in financials and utilities will behave differently during rate cycles than a balanced fund. Payout ratio and turnover add sustainability and tax context. Payout ratio is the percentage of a company’s earnings paid out as dividends. Ratios above 100 percent mean dividends exceed current profits and may be unsustainable. At the fund level, check that most holdings have payout ratios comfortably under 75 percent to 80 percent. Turnover measures how often the fund buys and sells. Turnover above 50 percent can trigger extra capital-gains distributions and trading costs that reduce net returns.
| Metric | What It Measures | Typical Range | What to Watch For |
|---|---|---|---|
| TTM Yield | Actual distributions paid over the last twelve months, divided by current price | Equity dividend funds: 1.5%–4.5%; bond income funds: 3%–7% | Big gap vs. SEC yield may signal non-repeating distributions or recent changes |
| Expense Ratio | Annual fee as a percentage of assets | Passive ETFs: 0.03%–0.10%; active funds: 0.30%–1.00% | Every 0.10% adds up over decades; favor low-cost options for core holdings |
| Holdings Count | Number of individual securities in the portfolio | High-yield funds: 50–150; broad dividend funds: 300–400 | Fewer holdings mean more concentration risk; one dividend cut has larger impact |
| Payout Ratio | Dividends per share divided by earnings per share for underlying stocks | Healthy range: well below 75%–80% depending on sector | Ratios above 100% signal dividends exceed profits and may be cut |
Dividend Fund Risks and How to Identify Red Flags
Dividend funds carry real risks that income-focused investors sometimes overlook in the search for steady cash flow. Companies can and do cut dividends, especially during recessions or industry downturns. Share prices of dividend-heavy funds can fall just as hard as the broader market when valuations reset or when interest rates rise and make bonds more attractive. Concentration in a few sectors or a handful of large positions magnifies the damage when one industry or stock stumbles. Recognizing warning signs early helps you avoid funds with fragile income streams or hidden vulnerabilities.
Dividend cuts hit portfolios when companies face shrinking profits, rising debt, or strategic shifts. The 2020 pandemic saw sixty-eight S&P 500 companies suspend or reduce payouts as cash flow dried up. Even one or two large cuts in a concentrated fund can reduce your quarterly income by 10 percent or more overnight. Yield traps occur when a stock’s dividend yield spikes because the share price is falling, not because the company raised its payout. A stock yielding 8 percent in a market where peers yield 3 percent may signal distress rather than opportunity. Funds that chase the highest current yields without checking payout ratios and balance sheets can end up holding a basket of yield traps that deliver one fat distribution before cutting. Interest-rate sensitivity also bites dividend funds, especially those heavy in utilities, real estate, and financials. When Treasury yields climb, income investors can earn more in bonds with less risk, and dividend stock valuations compress. Long-duration bond funds in the income category can lose several percentage points of price for every 1 percent rise in rates, offsetting much of the yield advantage.
Common red flags to check before buying a dividend fund:
- Payout ratio above 100 percent for multiple holdings: Dividends funded by borrowing or asset sales rather than earnings are unlikely to last.
- Yield far above peers or benchmarks: A fund yielding double the ten-year Treasury rate or twice the S&P 500 average may be taking hidden credit or concentration risk.
- Heavy sector concentration: A fund with more than 30 percent in one sector faces larger losses if that industry hits trouble. Financials during a credit crisis, energy during an oil crash.
- High leverage in underlying companies: Check the fund’s holdings for firms with debt-to-equity ratios above industry norms. High debt competes with dividends for cash and raises cut risk during downturns.
- Long duration in bond holdings: For hybrid or bond-income funds, effective duration above six years means significant price sensitivity to rate moves. A 1 percent rate increase can erase roughly 6 percent of the fund’s price.
Comparing Dividend Funds vs. Growth Funds for Long-Term Planning

Dividend funds and growth funds represent two ends of the equity investing spectrum, each with distinct return profiles and roles in a diversified portfolio. Dividend funds trade some upside potential for regular cash income and often show lower volatility during market turbulence. Growth funds reinvest profits into expansion rather than paying dividends, aiming for faster price appreciation over time. Neither approach is universally better. The right mix depends on your stage of life, income needs, and how you react to market swings.
Dividend-focused equity funds have delivered five-year annualized total returns in the 6 percent to 12 percent range through most recent market cycles, with volatility typically between 10 percent and 18 percent. Growth funds often post higher returns during strong bull markets, sometimes in the low-to-mid teens annually, but with wider swings and steeper drawdowns when sentiment shifts. Historical data shows that reinvested dividends contributed roughly 69 percent of the S&P 500’s total return from 1960 onward. That underscores the long-term compounding power of income. During periods when value stocks outperform growth, often when the economy recovers from recession or when interest rates stabilize, dividend funds can deliver higher total returns with smaller peak-to-trough declines.
The core trade-offs shape how you allocate between the two. Growth funds shine when corporate earnings accelerate, technology leads the market, and investors prioritize future potential over current payouts. Dividend funds pull ahead when markets rotate toward mature, cash-generating companies or when volatility spikes and investors seek income ballast. For younger investors building wealth, growth funds may capture more upside and allow compounding over decades before income is needed. For retirees or those nearing retirement, dividend funds provide predictable cash flow and may cushion portfolios during corrections, even if they lag during explosive rallies.
When dividend funds tend to outperform and when growth funds dominate:
- Dividend funds outperform: During value rotations, late-cycle economies, rising-rate environments where bond yields climb slowly, and bear-market recoveries when investors favor stability and income over speculative growth.
- Growth funds outperform: In early bull markets, low-rate environments that favor long-duration assets, periods of rapid innovation or sector leadership in technology, and when corporate profit growth accelerates faster than dividend capacity.
- Balanced approach: Many investors hold both, using dividend funds for income and downside cushion and growth funds for capital appreciation, rebalancing annually to maintain target weights as performance diverges.
- Reinvestment timing: Reinvesting dividends during market dips buys more shares at lower prices, amplifying long-term returns. Turning on distributions near retirement shifts the same fund from a growth tool to an income source.
Tax Treatment of Dividends: What Investors Need to Know

Dividends create taxable income in the year you receive them, even if you reinvest every dollar. Understanding the difference between qualified and ordinary dividends, along with capital-gains distributions from mutual funds, helps you estimate your after-tax return and decide whether to hold dividend funds in taxable accounts or shelter them in tax-advantaged retirement accounts. Small tax-planning moves compound into meaningful savings over decades of regular distributions.
Qualified dividends receive preferential tax treatment at long-term capital gains rates: 0 percent, 15 percent, or 20 percent depending on your taxable income bracket. To qualify, the dividend must come from a U.S. corporation or a qualifying foreign company, and you must have held the stock for more than sixty days during the one hundred twenty-one-day period surrounding the ex-dividend date. Most dividends from large, established U.S. companies meet these rules. Ordinary dividends, which include distributions from real estate investment trusts (REITs), master limited partnerships (MLPs), and certain foreign stocks, are taxed at your regular income rate, which can be as high as 37 percent for top earners. Bond interest paid through bond-income funds is also taxed as ordinary income. High-income investors may owe an additional 3.8 percent net investment income tax on dividends and capital gains if their modified adjusted gross income exceeds statutory thresholds.
Mutual funds add complexity by distributing realized capital gains at year-end. When the fund manager sells securities at a profit, the gain passes through to shareholders as a taxable capital-gains distribution, even if you didn’t sell any fund shares yourself. High-turnover funds generate more short-term capital gains taxed at ordinary rates, while low-turnover funds produce mostly long-term gains at preferential rates. ETFs use an in-kind creation and redemption process that defers most capital gains, making them more tax-efficient in taxable accounts than traditional mutual funds. Reinvested dividends still create a tax bill. The brokerage reports the distribution as income and adjusts your cost basis upward by the reinvested amount, preventing double taxation when you eventually sell.
Tax implications summarized for practical planning:
- Qualified dividends: Taxed at 0 percent, 15 percent, or 20 percent depending on income. Most U.S. large-cap dividend stocks qualify if you hold shares long enough.
- Ordinary dividends and bond interest: Taxed at your marginal income rate, which can be nearly double the qualified-dividend rate for high earners. REIT and MLP distributions typically fall into this bucket.
- Capital-gains distributions: Mutual funds may distribute realized gains annually, creating surprise tax bills. Check a fund’s distribution history and turnover before buying in a taxable account.
- Tax-advantaged accounts: Holding dividend funds in IRAs, 401(k)s, or Roth accounts eliminates annual tax on distributions and lets income compound untaxed. Roth accounts offer tax-free income in retirement if rules are met.
Practical Screening Criteria for Choosing Strong Dividend Funds
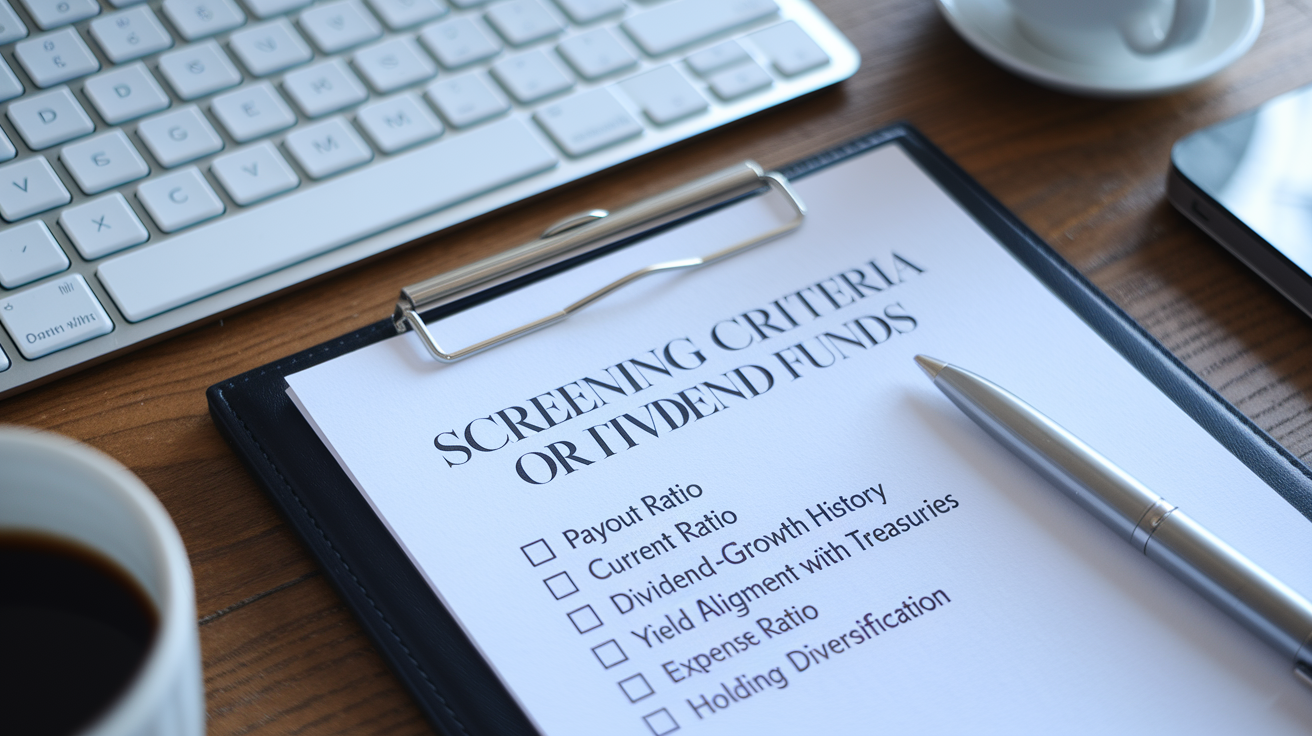
Selecting a dividend fund that delivers reliable income without hidden risks requires a disciplined screening process. Start with yield and expense ratio to filter for income potential and cost efficiency, then layer in quality checks: payout sustainability, balance-sheet strength, dividend-growth history, and sector diversification. These filters help you avoid funds built on shaky payouts or excessive concentration and point you toward portfolios likely to maintain distributions through market cycles.
Focus on payout ratios that leave room for earnings volatility. At the individual-stock level, favor companies paying out well below 75 percent to 80 percent of earnings as dividends, depending on the sector. Utilities and REITs may run higher payout ratios as part of their business model, but industrial and consumer companies with ratios near 100 percent have little margin for error if profits slip. At the fund level, check that the majority of top holdings show sustainable payout ratios. Balance-sheet metrics add another layer of confidence. A current ratio of 2.0 or higher (current assets divided by current liabilities) indicates a company can cover short-term obligations and has cash cushion to maintain dividends during rough patches. High debt loads compete with dividends for cash. Companies with debt-to-equity ratios significantly above their industry median face higher cut risk during downturns or rising-rate cycles.
Dividend-growth history separates consistent compounders from one-time high yielders. Funds that require holdings to have raised dividends for at least three consecutive years, or ideally ten or more, tilt portfolios toward financially healthy businesses with pricing power and growing cash flow. Yield alignment with Treasury benchmarks offers a reality check. A dividend fund yielding roughly in line with the ten-year Treasury rate is drawing income from corporate profits. A fund yielding twice the Treasury rate or more may be reaching into riskier credits, higher payout ratios, or sectors vulnerable to cuts. Finally, verify sector diversification and holdings count. Funds with fewer than one hundred names or more than 30 percent in a single sector concentrate risk. Broad funds holding three hundred or more stocks and capping sector weights under 25 percent spread risk more evenly.
Six screening criteria to apply before investing:
- Payout ratio below 75 percent to 80 percent: Ensures dividends are covered by current earnings with a buffer for economic downturns.
- Current ratio of 2.0 or higher: Indicates strong liquidity and ability to meet short-term obligations without cutting dividends.
- Consistent annual dividend increases over 3 to 10 years: Signals financial health, pricing power, and management commitment to returning cash to shareholders.
- Yield aligned with Treasury benchmarks: Avoid yields far above the ten-year Treasury rate unless you understand and accept the extra risk.
- Expense ratio at or below category median: Passive dividend ETFs should charge under 0.10 percent. Active funds should justify fees above 0.30 percent with measurable alpha.
- Holdings count and sector diversification: Prefer funds with at least one hundred names and no single sector above 25 percent to reduce concentration risk.
Sample Dividend Fund Profiles and What Their Metrics Show

Four widely held dividend ETFs illustrate the range of strategies available to income investors. Each fund follows a different index construction rule, leading to distinct yield profiles, sector tilts, and holdings counts. Comparing their metrics side by side shows how small differences in screening criteria produce meaningfully different income streams and risk exposures. Always verify current yields, expense ratios, and top holdings before buying, as fund characteristics drift over time with market moves and rebalancing.
Vanguard High Dividend Yield ETF (VYM) casts a wide net, holding three hundred to four hundred dividend-paying U.S. stocks with above-average yields while excluding REITs. The fund’s yield typically ranges from 3.0 percent to 3.5 percent, and the expense ratio sits near 0.06 percent, six dollars annually on a ten thousand dollar investment. With hundreds of names, single-stock risk is minimal, and the portfolio spreads across sectors, though financials and healthcare often represent the largest weights. VYM works well as a core holding for investors who want broad high-dividend exposure without paying active-management fees.
Schwab U.S. Dividend Equity ETF (SCHD) narrows the field to roughly one hundred companies that have paid dividends for at least ten consecutive years and pass screens for financial health and dividend sustainability. SCHD’s yield also ranges around 3.0 percent to 3.5 percent with a 0.06 percent expense ratio, but the smaller portfolio introduces more single-stock concentration. Sector weights often tilt toward consumer staples, healthcare, and energy. The fund’s focus on quality and longevity aims to reduce dividend-cut risk, making it popular among retirees seeking stable income. Best Dividend ETFs to Buy Now offers additional context on how SCHD and similar funds stack up across different market environments.
Vanguard Dividend Appreciation ETF (VIG) takes a dividend-growth approach, holding one hundred fifty to two hundred U.S. stocks that have increased dividends annually for at least ten years. Because the fund prioritizes dividend growth over current yield, VIG’s yield is lower, typically 1.5 percent to 2.0 percent, but the portfolio includes more capital-appreciation potential from companies reinvesting profits for expansion. The 0.06 percent expense ratio keeps costs low. VIG suits long-term investors who want income that rises over time and can accept a smaller starting yield in exchange for compounding distributions. Why and How to Invest in Dividend-Paying Stocks explains the mechanics of how dividend growth can drive total returns over multi-decade holding periods.
SPDR S&P Dividend ETF (SDY) tracks the S&P High Yield Dividend Aristocrats Index, selecting roughly one hundred companies from the S&P Composite 1500 that have raised dividends for at least twenty consecutive years. SDY’s yield typically sits between 3.0 percent and 4.0 percent, higher than VIG but achieved through a stricter dividend-history requirement. The expense ratio is 0.35 percent, notably above the Vanguard and Schwab options, adding thirty-five dollars per year on a ten thousand dollar holding. The fund’s mid-cap value tilt and sector weights (often heavy in industrials, consumer staples, and utilities) give it a different performance profile than large-cap-focused VYM or SCHD.
| Fund | Yield Range | Expense Ratio | Typical Holdings Count |
|---|---|---|---|
| VYM | 3.0%–3.5% | 0.06% | 300–400 |
| SCHD | 3.0%–3.5% | 0.06% | 60–120 |
| VIG | 1.5%–2.0% | 0.06% | 150–200 |
| SDY | 3.0%–4.0% | 0.35% | ~100 |
How Dividend Funds Support Retirement and Income Planning

Dividend funds fit naturally into retirement portfolios by generating predictable cash flow without requiring you to sell shares. Retirees often allocate between 30 percent and 60 percent of their equity and income sleeve to dividend-focused funds, adjusting the mix based on spending needs, Social Security income, and risk tolerance. During the accumulation phase, younger investors can reinvest distributions to accelerate compounding, then flip the switch to cash payouts in retirement without changing the underlying investment. This dual-purpose flexibility makes dividend funds a cornerstone of many long-term plans.
Regular distributions smooth income throughout the year, reducing the need to time sales or guess when to liquidate growth holdings. A retiree drawing 4 percent annually from a portfolio can cover much of that through dividend income alone if the equity allocation yields 3 percent to 3.5 percent. The remaining gap comes from bond interest or modest share sales, preserving more principal during market downturns. Dividend funds also tend to show smaller drawdowns than pure growth funds in certain market cycles, offering psychological comfort when account balances wobble. A portfolio that paid steady income through a 20 percent market correction feels less alarming than one that relies entirely on selling depreciated shares.
Compounding through reinvestment during working years sets up higher retirement income later. A dividend-growth fund yielding 2 percent today but raising distributions 6 percent per year will yield roughly 4 percent on your original investment after twelve years. That rising income keeps pace with inflation and reduces the need to draw down principal. Geographic and sector diversification through dividend funds also spreads risk across industries and regions, so a dividend cut in U.S. energy or European banks doesn’t derail your entire income plan.
Ways dividend funds stabilize cash flow and reduce retirement risk:
- Predictable quarterly or monthly income: Distributions arrive on a set schedule, making it easier to budget expenses and avoid forced sales during market dips.
- Lower sequence-of-returns risk: Regular income reduces the need to sell shares early in retirement, protecting you from locking in losses during a bear market.
- Inflation hedge through dividend growth: Funds focused on dividend raisers deliver income that climbs over time, helping purchasing power keep up with rising costs.
- Psychological comfort: Seeing cash deposits each quarter can reduce the urge to sell during volatility, keeping you invested for the eventual recovery.
- Flexible income vs. growth mode: The same fund can compound wealth during accumulation through reinvestment and provide income in retirement by switching distributions to cash.
Best Practices for Long-Term Dividend Fund Investors

Holding dividend funds successfully over decades requires a handful of steady habits and simple rules. Reinvest distributions during your working years to let compounding work, diversify across high-yield and dividend-growth strategies to balance current income and future raises, and rebalance annually to maintain your target allocation. Monitor fund expenses and turnover because small differences compound into large drags on returns. Check distribution stability each year rather than chasing the highest yield on offer, and keep enough of your portfolio in bonds or cash to cover short-term needs so you never have to sell dividend funds at the worst moment.
Reinvestment accelerates wealth-building by buying more shares with each distribution, so your next payout is slightly larger. Over thirty years, reinvesting a 3 percent yield that grows 5 percent annually can double your income and significantly boost your ending balance compared to taking cash. ETFs offer daily liquidity, letting you buy or sell anytime during market hours, while mutual funds price once at the close of each trading day. For dividend funds, liquidity rarely matters unless you need to exit quickly. The real advantage of ETFs is their tax efficiency in taxable accounts due to lower capital-gains distributions.
Turnover and fees shape your net return silently year after year. A fund with 10 percent annual turnover holds most positions for a decade, minimizing trading costs and taxable gains. A fund with 60 percent turnover replaces more than half its portfolio annually, racking up transaction expenses and short-term capital gains taxed at ordinary rates. Expense ratios below 0.10 percent leave more income in your pocket. Fees above 0.50 percent need to be justified by clear outperformance or unique access. Distribution stability matters more than chasing the top yield. A fund that paid the same or higher quarterly distributions for the past five years signals sustainable income. A fund that cut distributions twice in three years may deliver a high current yield today but leave you short next year.
Five best practices to maintain a successful dividend portfolio:
- Reinvest distributions during accumulation: Automate reinvestment through your brokerage to compound returns without additional deposits. Switch to cash payouts when you need income.
- Rebalance annually: If dividend funds drift above or below your target allocation, trim winners and add to laggards once per year to control risk and lock in gains.
- Check turnover and expenses yearly: Review fund fact sheets each year. Consider swapping high-cost or high-turnover funds for cheaper alternatives if performance doesn’t justify the fees.
- Diversify across yield and growth strategies: Hold both high-yield funds for current income and dividend-growth funds for rising payouts, spreading risk across different company profiles.
- Monitor distribution stability, not just headline yield: Track whether quarterly payouts stayed flat, grew, or shrank over the past few years. Consistent or rising distributions signal healthier underlying portfolios than erratic payments.
Final Words
Jump in with your goals and timeline: you learned how dividend funds generate income, the main types, and what yield and fees really tell you.
Next, use simple screens, payout ratios, expense ratios, holdings, and watch for red flags like extreme yields or sector crowding.
Remember tax rules and where dividend funds fit in retirement plans. Reinvesting and yearly rebalancing help returns and steady cash flow.
Start small, stay consistent, and you can build a steady income stream with dividend funds that fits your needs.
FAQ
Q: What is the best fund for dividends?
A: The best fund for dividends depends on your goals. Choose a low-cost, diversified dividend ETF or mutual fund with a sustainable yield and healthy holdings, since higher yields often mean higher risk, a tradeoff to consider.
Q: What is the dividend fund?
A: The dividend fund is a pooled investment that buys dividend-paying stocks or bonds to deliver regular income. Equity dividend funds often yield about 1.5%–4.5%, while bond income funds can yield more but carry different risks.
Q: How much money do you need to make $100,000 a year in dividends?
A: To make $100,000 a year in dividends, divide income by yield. At 3% you’d need about $3.33 million; at 4% about $2.5 million; at 5% about $2 million. Taxes and payout sustainability matter.
Q: Is a dividend fund a good investment?
A: A dividend fund is a good investment if you want steady income and generally lower volatility. It depends on your timeline and risk tolerance—watch fees, payout sustainability, and avoid chasing very high yields.

