

What if your money handed you a raise every year without you lifting a finger?
A dividend growth fund (a mutual fund or ETF that owns companies that raise their dividends year after year) aims for that outcome.
Instead of hunting for the highest yield today, you pick steady raisers that grow income and let compounding do the rest.
It’s a good fit for long-term savers and folks nearing retirement, though you’ll trade off some short-term price swings and sensitivity to interest rates.
Core Overview of Dividend Growth Funds and How They Work

A dividend growth fund is a mutual fund or ETF that buys companies with a habit of bumping up their dividend every year. You’re not hunting for the fattest yield today. You’re betting on businesses that raise dividends reliably, often for five, ten, or more years straight, counting on that steady income climb plus share price gains to stack up solid total returns.
The wrapper matters. ETFs trade all day like stocks, usually carry rock bottom expense ratios, and skip load fees. Mutual funds price once daily at net asset value and can stick you with sales loads or fatter management fees, though some throw in automated perks like built in dividend reinvestment.
Funds use eligibility screens to pick which stocks make the cut. A typical rulebook wants at least five consecutive years of dividend raises, a payout ratio (the slice of earnings paid out) under 60 to 75 percent, positive free cash flow over the trailing twelve months, and a minimum market cap, often one to five billion. These screens weed out companies paying a juicy yield now but lacking the muscle to keep raising payments when recession hits. Representative names include Vanguard Dividend Appreciation ETF (VIG), Schwab U.S. Dividend Equity ETF (SCHD), and iShares Core Dividend Growth ETF (DGRO), each tweaking index rules and sector weights a bit differently.
Rising dividends fuel compounding two ways. First, when you reinvest each payment, you buy more shares. Those new shares spin off their own dividends, snowball style. Second, a company growing its dividend five percent annually will double the payout in roughly fifteen years. Your income on the original investment keeps climbing even if the share price sits flat. Over long stretches, dividend growth strategies have clocked six to ten percent annualized total returns, with dividends adding somewhere between 1.5 and 3.5 percentage points. The stability comes from established dividend growers having predictable cash flows and strong balance sheets, cushioning swings when markets tank.
Dividend growth funds tend to suit:
- Investors nearing or in retirement who need income that climbs to keep pace with living costs.
- Mid career savers building a second income stream without chasing risky high yield stocks.
- Conservative investors wanting less volatility than pure growth portfolios.
- Tax conscious investors in higher brackets who prefer qualified dividend rates over ordinary income.
- Long term buy and hold investors who value predictable cash flow and compounding reinvestment.
Key Benefits Offered by Dividend Growth Funds

The headline win is income that climbs every year without you doing anything. A company raising its dividend five percent annually hands you a 28 percent raise over five years, assuming you hold the same shares. When you reinvest those dividends into more shares, the effect compounds. Each new share also earns dividends that grow at five percent. Over twenty years, this double compounding can turn a modest 2 percent starting yield into a 5 or 6 percent yield on your original cost, all while the share price may also climb.
Another plus is resilience during inflation. Companies that can raise prices and protect margins tend to pass some of that pricing power to shareholders as higher dividends. Historically, periods of moderate inflation have coincided with strong performance from dividend growth portfolios. The income stream rises while bonds and fixed payout securities lose purchasing power.
Lower volatility is a third benefit. Dividend growers often have stable earnings, established market positions, and conservative capital structures. All of that reduces wild swings in share price. That doesn’t mean dividend funds never fall. They do. But the mix of steady income and lower beta can smooth the ride compared to tech heavy growth funds.
Core benefits at a glance:
- Income that grows automatically without needing to sell shares or time the market.
- Compounding acceleration when dividends are reinvested into more shares that also pay rising dividends.
- Inflation hedge through companies that can raise prices and pass gains to shareholders.
- Lower volatility on average because dividend growers tend to be established, profitable businesses.
- Behavioral anchor that discourages panic selling, since regular income provides a psychological cushion during downturns.
- Tax favored treatment in many cases, with qualified dividends taxed at long term capital gains rates instead of ordinary income.
Risks and Tradeoffs in Dividend Growth Funds

Rising interest rates can pressure dividend growth fund prices. Investors compare dividend yields to bond yields. When the 10 year Treasury yield jumps from 2 percent to 4 percent, dividend paying stocks yielding 2.5 percent look less attractive. Share prices may fall until yields rise enough to compete again. This rate sensitivity doesn’t guarantee losses. Capital appreciation and dividend growth can offset the headwind. But short term returns often suffer during steep rate hike cycles. The impact varies by fund. Those holding high quality businesses with strong pricing power tend to recover faster than funds weighted toward slow growth utilities.
Sector concentration is another trap. Many dividend growth funds tilt heavily toward consumer staples (food and household products), industrials (machinery, transportation), and financials (banks, insurance). It’s not unusual to see the top five sectors account for 40 percent or more of a fund’s assets. That concentration means the fund will underperform if those sectors fall out of favor or face headwinds like regulatory changes or commodity price swings. Diversification within the fund helps. But it doesn’t eliminate sector risk when half the portfolio marches to the same economic drum.
Dividend safety is never guaranteed. A company can freeze or cut its dividend if earnings fall, cash flow dries up, or management decides to redirect capital to acquisitions or debt paydown. Warning signs include a rising payout ratio above 70 percent for several quarters, shrinking free cash flow, flat or declining revenue, and repeated earnings misses. When a major holding in your fund slashes its dividend, the fund’s income drops and the share price of that holding usually tumbles, dragging down your total return. Funds that screen strictly for long dividend growth streaks and conservative payout ratios reduce this risk but can’t eliminate it, especially during recessions when even blue chip companies face tough choices.
Comprehensive Evaluation and Screening Criteria for Dividend Growth Funds

At the fund level, the trailing yield tells you how much income the fund paid over the past twelve months as a percentage of its current price. A yield of 2.5 percent on a $100 share means you collected $2.50 in dividends last year. That number alone doesn’t predict future income. You also need the dividend growth compound annual growth rate over three to ten years, which shows the pace at which the fund’s per share distribution has climbed. A 5 percent dividend CAGR means the income doubled roughly every 14 years if that pace holds.
Compare one, three, five, and ten year annualized total returns against a benchmark like the S&P 500 or a dividend focused index to see if the fund delivered competitive performance. Volatility (annualized standard deviation) and maximum drawdown (the largest peak to trough drop) reveal how bumpy the ride was. Turnover rate indicates how often the fund manager trades holdings. Low turnover, under 30 percent annually, usually means lower transaction costs and better tax efficiency.
Underneath the fund wrapper, the quality of individual holdings drives long term results. Strong dividend growers typically show positive year over year earnings growth, stable or rising free cash flow, and payout ratios well below 75 percent. Free cash flow coverage matters because dividends come from cash, not accounting earnings. If a company reports $1 per share in earnings but only generates $0.60 in free cash flow per share while paying a $0.70 dividend, it’s borrowing or burning reserves to maintain the payout. Red flag.
Look at the fund’s top ten holdings, which often represent 20 to 40 percent of total assets. If three of the top ten are in the same industry, or if several have payout ratios above 70 percent, concentration risk and dividend safety risk both rise.
Top holding review also exposes sector tilts that the fund’s marketing materials might gloss over. A fund marketed as “diversified dividend growth” might have 25 percent in financials and another 20 percent in consumer staples, leaving you overexposed to banking regulation and commodity cost inflation. Check the sector breakdown in the fund fact sheet, then cross reference the largest individual positions to confirm they meet your quality standards. If a top holding recently cut guidance, suspended buybacks, or saw its payout ratio jump, that stock may be on the watchlist for a dividend freeze. The fund may lag until the manager trims or exits the position.
| Metric | What It Indicates |
|---|---|
| Trailing Yield | How much income the fund distributed over the past 12 months as a percentage of current price; higher isn’t always better if growth is weak. |
| Dividend Growth CAGR | Annual rate at which the fund’s per share distribution has increased over three to ten years; signals income trajectory. |
| Payout Ratio | Percentage of earnings (or free cash flow) paid as dividends; below 60 to 75% suggests room for future increases and safety buffer. |
| 10 Year Annualized Return | Total return (price change plus reinvested dividends) compounded annually over a decade; shows long term performance track record. |
| Turnover Rate | How often the fund buys and sells holdings each year; lower turnover typically means lower taxes and trading costs. |
Comparing Representative Dividend Growth Funds

Three ETFs dominate the dividend growth conversation. They combine low costs, long track records, and clear screening rules. Each fund uses a slightly different methodology. Yields, sector weights, and volatility profiles vary. Understanding what each fund screens for helps you match the right option to your income goals and risk tolerance.
Vanguard Dividend Appreciation ETF (VIG)
VIG tracks an index of companies that have increased dividends for at least ten consecutive years, filtering out the highest yielding stocks to focus on sustainable growers with moderate current yields. The fund tends to hold large cap, high quality businesses with strong balance sheets, resulting in a lower trailing yield, often 1.6 to 2.0 percent, but solid long term price appreciation. Investors who want steady income growth without chasing yield spikes typically favor VIG for its low turnover and blue chip portfolio.
Schwab U.S. Dividend Equity ETF (SCHD)
SCHD screens for quality and value, selecting 100 U.S. stocks with at least ten years of dividend growth, strong free cash flow, and attractive valuations based on metrics like cash flow yield and return on equity. The result is a higher trailing yield, commonly 2.5 to 3.5 percent, and a tilt toward financials and industrials. SCHD appeals to investors who want a blend of income and value exposure, accepting slightly higher sector concentration in exchange for better current yield and dividend growth potential.
iShares Core Dividend Growth ETF (DGRO)
DGRO casts a wider net, requiring only five consecutive years of dividend increases and applying lighter quality screens. That lets it hold mid cap and some smaller dividend growers alongside large caps. The broader universe means more diversification by company count, often 400 to 500 holdings, and a yield in the 1.6 to 2.0 percent range, similar to VIG but with a different sector mix. Investors who want exposure to emerging dividend growers and don’t mind a bit more volatility often choose DGRO for its wider market coverage.
| Fund | Yield | Expense Ratio | Inception Year |
|---|---|---|---|
| VIG | 1.6 to 2.0% | 0.06% | 2006 |
| SCHD | 2.5 to 3.5% | 0.06% | 2011 |
| DGRO | 1.6 to 2.0% | 0.08% | 2014 |
| SDY (SPDR S&P Dividend ETF) | 2.5 to 3.5% | 0.35% | 2005 |
Costs, Fees, and Tax Considerations for Dividend Growth Funds
Passive dividend growth ETFs typically charge expense ratios between 0.03 and 0.15 percent annually. A $10,000 investment pays $3 to $15 per year in management fees. Actively managed mutual funds often run 0.40 to 0.90 percent, and some carry front end sales loads (a commission paid when you buy) or back end loads (a fee if you sell within a set period). Load fees can eat 3 to 5 percent of your investment upfront, erasing years of dividend growth before you start. No load index funds and ETFs skip that cost entirely, making them the default choice unless an active manager has a strong, verified track record of beating the index after fees.
Tax treatment hinges on two things: the type of dividend and the account wrapper. Qualified dividends, paid by most U.S. corporations held for at least 60 days around the ex dividend date, are taxed at long term capital gains rates (0, 15, or 20 percent depending on your income, plus a potential 3.8 percent net investment income tax for high earners). Nonqualified dividends and distributions from funds with high turnover can trigger ordinary income tax rates, which top out at 37 percent federally.
After tax yield is what you actually keep. A 3 percent yield taxed at 15 percent leaves you with 2.55 percent. The same yield taxed at 37 percent drops to 1.89 percent. Account type matters, too. Holding a dividend fund in a tax deferred IRA or 401(k) shields dividends from annual tax, letting them compound faster. But you’ll pay ordinary income tax on every dollar you withdraw in retirement. Roth accounts offer the best of both worlds if you qualify: tax free dividends and tax free withdrawals.
Turnover amplifies tax drag in taxable accounts. A fund that replaces 50 percent of its holdings each year realizes capital gains, which flow through to shareholders as taxable distributions even if you never sold a share. Low turnover dividend growth ETFs, under 20 percent annual turnover, generate fewer taxable events, preserving more of your return. When comparing two similar funds, the one with lower turnover and a higher percentage of qualified dividends will usually deliver a better after tax result in a taxable brokerage account.
Tax efficient strategies to consider:
- Place higher yielding dividend funds in tax advantaged accounts (IRA, 401(k), or Roth) to defer or eliminate dividend taxes.
- Keep low turnover, qualified dividend ETFs in taxable accounts to benefit from preferential tax rates and minimize realized gains.
- Reinvest dividends automatically within tax advantaged accounts to compound without triggering annual tax bills.
- Harvest tax losses in taxable accounts by selling dividend funds at a loss to offset gains elsewhere, then replace with a similar (but not identical) fund to maintain exposure.
Building a Dividend Growth Allocation Within an Investment Portfolio
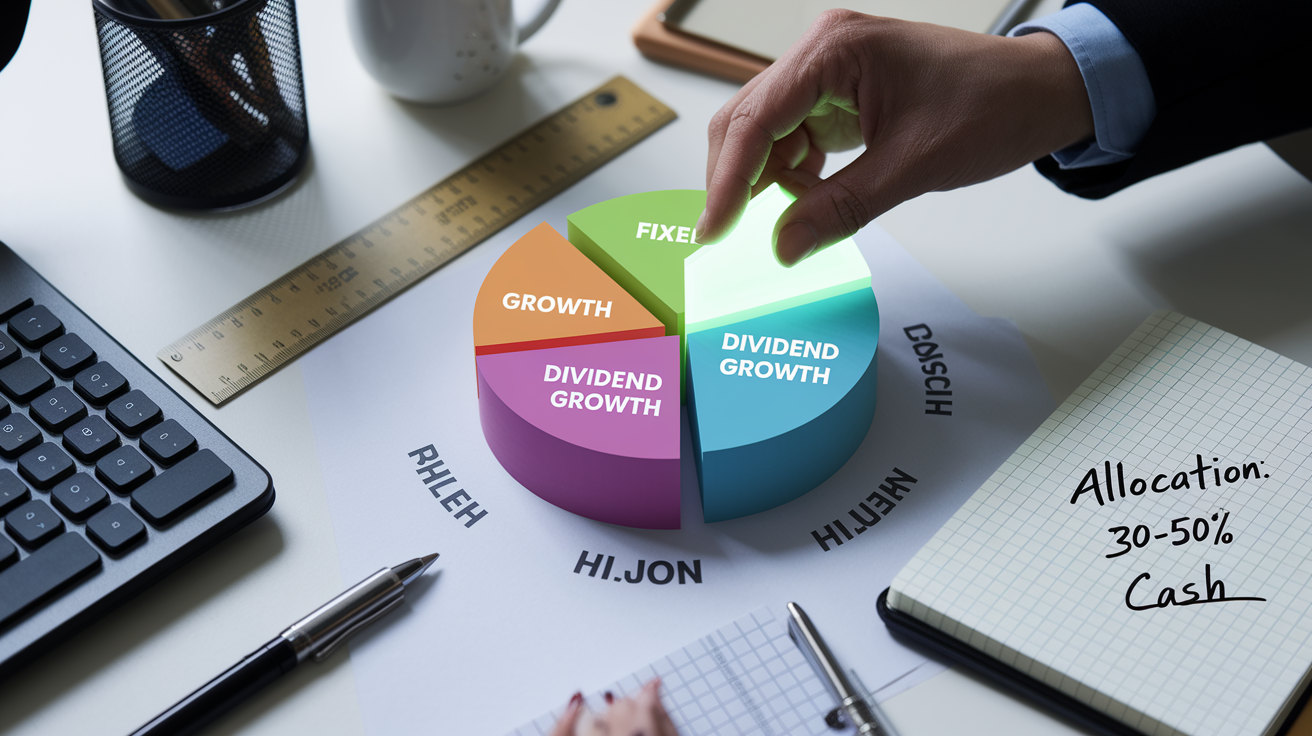
Start by deciding what percentage of your total portfolio should produce rising income versus pure growth or fixed income. A retiree drawing 4 percent annually might allocate 30 to 50 percent of the equity portion to dividend growth funds, paired with bonds and cash to smooth volatility and fund near term spending. A balanced investor in their 40s might dedicate 10 to 30 percent of the whole portfolio to dividend growth, using the rest for total market stock funds and bonds. An aggressive investor under 35 focused on wealth accumulation could hold just 5 to 15 percent in dividend growth funds, enough to sample the compounding benefits without sacrificing exposure to high growth sectors like technology.
Once you pick a target allocation, reinvestment policy shapes long term results. Automatic dividend reinvestment buys more shares with every payout, maximizing compound growth but providing zero cash flow. Taking dividends in cash gives you spending money or dry powder for rebalancing, but you miss the compounding snowball unless you manually reinvest. Most investors under 55 benefit from full reinvestment, letting time and compounding do the heavy lifting. Investors near or in retirement often split the difference, reinvesting dividends during strong market years and taking cash during drawdowns to avoid selling shares at depressed prices.
Five steps to integrate dividend growth funds into your plan:
- Set your equity versus income target based on time horizon and risk tolerance. Longer horizon, lower dividend growth allocation. Shorter horizon or income need, higher allocation.
- Choose one or two core dividend growth funds with low fees, long track records, and complementary screening rules. Pair a high quality fund like VIG with a higher yield value fund like SCHD, for example.
- Place the funds in the right account type. Tax advantaged for high yield or high turnover funds, taxable for low turnover qualified dividend funds.
- Automate contributions and reinvestment so dividends buy more shares every quarter without manual intervention.
- Rebalance annually by comparing your current dividend growth allocation to your target. Trim if it drifted above target, taking profits. Add if it fell below, buying the dip.
Market Conditions and How They Affect Dividend Growth Funds

Dividend growth funds often hold up better than pure growth portfolios during market downturns because the income stream provides a cushion and the underlying companies tend to have stable earnings. In the 2008 financial crisis, many dividend growers cut payouts. But funds that screened strictly for long dividend increase streaks, ten years or more, saw smaller drawdowns than the broader market and recovered faster. The steady income also gives investors a reason to hold through volatility instead of panic selling at the bottom. That defensive trait doesn’t eliminate losses. Dividend funds still fell 30 to 40 percent in 2008. But the combination of lower beta and reliable income reduces the urge to bail.
Inflation historically favors dividend growth strategies over fixed income investments. Companies that can raise prices without losing customers, branded consumer goods, essential industrials, and regulated utilities, often pass some of that pricing power through to shareholders as higher dividends. During the 1970s inflation surge, dividend paying stocks delivered positive real (inflation adjusted) returns while bonds and cash lost purchasing power. The same pattern played out in the 2021 to 2023 inflation spike. Dividend growers lagged tech stocks in 2021 but outperformed in 2022 when the Federal Reserve hiked rates and growth stocks sold off. The key is that rising dividends can keep pace with or beat inflation over multi year periods, whereas bond coupons stay fixed.
Risk adjusted return is where dividend growth funds shine. A portfolio that delivers 8 percent annualized returns with 12 percent volatility has a better Sharpe ratio (excess return per unit of risk) than a portfolio returning 10 percent with 18 percent volatility, assuming similar risk free rates. Dividend growth funds typically land in the middle, offering 7 to 9 percent long term returns with 10 to 14 percent volatility, compared to 10 to 12 percent returns and 15 to 20 percent volatility for growth heavy indexes. The smoother ride helps investors stick with the plan, which often matters more than chasing an extra percentage point of return that comes with stomach churning swings.
Monitoring and Maintaining a Dividend Growth Fund Strategy

Review your dividend growth holdings at least once a year, ideally after the fund publishes its annual report and updated fact sheet. Check whether the trailing yield has drifted up or down relative to your expectations. A sharp yield spike can signal a price drop that may be temporary or a warning of trouble in the portfolio. Compare the fund’s one year and three year total returns to its benchmark and peer group to confirm it’s still delivering competitive performance. If the fund has lagged for three consecutive years and the expense ratio crept higher, that combination suggests it may be time to switch to a lower cost or better performing alternative.
Reinvestment versus cash distribution is a choice you can adjust as your life changes. Early in your career, automatic reinvestment accelerates compounding and requires zero effort. As you approach retirement, you might flip some or all dividends to cash, using the income to cover living expenses and leaving your principal untouched. A hybrid approach works well during the transition years. Reinvest dividends when the market is down, buying more shares cheap. Take cash when the market is up, harvesting gains without selling shares. Many brokerage platforms let you toggle reinvestment on and off by fund, so you can customize the setting for each holding.
Six items to monitor and adjust over time:
- Review interval: annual deep dive into performance, fees, and holdings. Quarterly glance at yield and top sector weights.
- Reinvestment policy: full reinvestment during accumulation years. Partial or zero reinvestment when you need income or want to rebalance manually.
- Allocation drift: if dividend growth funds grow faster than the rest of your portfolio, trim back to target to lock in gains and maintain diversification.
- Expense changes: watch for fee increases or fund mergers that hike costs. Switch to a cheaper equivalent if fees jump without clear added value.
- Fund methodology updates: index providers occasionally tweak eligibility rules, raising the minimum dividend growth streak from 5 to 7 years, for example. Confirm the new rules still match your goals.
- Life stage adjustments: as you move from wealth accumulation to income distribution, gradually shift from lower yielding growth focused dividend funds to higher yielding, more conservative options, keeping the total equity allocation consistent with your risk tolerance.
Final Words
You learned how dividend growth funds pick companies that raise payouts and how that supports compounding income over time.
We covered the main benefits, key risks like rate pressure and sector concentration, practical screening metrics, sample funds, costs, tax points, and how to fit these funds into a portfolio.
If you want a simple, steady approach, consider a modest allocation, regular monitoring, and yearly rebalancing. A dividend growth fund can provide rising income and lower volatility over time, but it still needs attention and realistic expectations. Start small and stay consistent.
FAQ
Q: What is the best dividend growth fund?
A: The best dividend growth fund depends on your goals; VIG offers low fees and steady growth, SCHD targets higher yield, and DGRO blends yield with growth—pick by yield, cost, and risk.
Q: How much money do I need to make $1,000 or $10,000 a month in dividends?
A: The money you need to make $1,000 or $10,000 a month in dividends depends on fund yield; at typical 1.5%–3.5% yields you’d need roughly $343k–$800k for $1,000/month, or $3.43m–$8m for $10,000/month. Plan for volatility and reinvestment.
Q: What is a dividend growth fund?
A: A dividend growth fund is a mutual fund or ETF that buys companies that raise their payouts regularly; it aims for rising income, modest yields (about 1.5%–3.5%), and long-term compounding.

