

What if the ETF you own is quietly trading away your returns every quarter?
Before you buy, the clearest way to stop guessing is to read the index methodology and rebalancing rules—the paperwork that tells you how often the fund trades, why it buys or sells, and when changes take effect.
This post walks you through the simple things to look for—weighting method, rebalance calendar, announcement lags, and buffer rules—so you can spot turnover risks and predict how disruptive rebalances will be.
Key Steps to Reviewing an ETF’s Index Methodology and Rebalancing Rules

Before you put money into an ETF, grab the documents that explain how it actually operates. You’ll want the prospectus, the fund fact sheet, the index methodology from the index provider, and recent reconstitution reports if you can find them. These papers lay out the rules the fund follows to maintain its exposure and track the benchmark. Reading them gets rid of the guesswork and shows you how often trades happen, what triggers changes, and whether rebalancing will be smooth or chaotic. Skip this and you’re just guessing.
Once you’ve got the documents, pull out the weighting approach (market cap, equal weight, factor based), the rebalancing schedule (monthly, quarterly, twice a year), and when they announce changes. Look for the effective dates when trades actually go through and the cut-off dates that determine which holdings qualify. These details tell you how much turnover the fund creates, how predictable its trades are, and whether other traders can front run the rebalancing and force the ETF to buy high or sell low.
- Grab all published methodology documents from the ETF provider’s site, the index provider’s methodology library, and regulatory filings.
- Figure out the document structure by scanning the table of contents for sections on selection criteria, weighting calculation, reconstitution timing, and buffer rules.
- Pull out the weighting rules to see if the fund is market cap weighted, equal weighted, factor weighted, or something else, and note any concentration caps.
- Get the rebalancing schedule including exact calendar dates, frequency (monthly, quarterly, annual), and whether the schedule is fixed or left to discretion.
- Map announcement timing by finding the gap between when index changes are announced and when they take effect, since short windows make it harder to adjust your positions.
- Look for warning signs like vague language on eligibility, missing reconstitution calendars, or frequent methodology changes that suggest instability or manipulation risk.
This kind of review improves your grasp of the fund’s operational risk, the turnover and trading costs you’ll eat, and how transparent the rebalancing rules are. If the methodology is clear and the schedule is published months ahead, you can predict what the fund will do next and decide if the index design fits your goals and risk tolerance.
Understanding ETF Index Construction Criteria

Index construction is what determines which securities get in and which get kicked out. Consistent, transparent eligibility rules matter because they create predictable membership and cut down on unnecessary trading. When the criteria shift all the time or stay vague, turnover goes up, tracking error grows, and you absorb higher costs without warning. The construction methodology sets the boundaries for everything that comes after, so reading the eligibility rules first gives you the clearest picture of the fund’s universe and how often that universe changes.
Common criteria include minimum market cap thresholds, average daily trading volume requirements to ensure liquidity, listing and geographic eligibility rules, sector or industry classifications, and financial health filters like profitability tests, price to earnings limits, price to book boundaries, or minimum dividend yields. Some indices also apply governance screens, ESG filters, or currency requirements. Each filter narrows the pool of eligible holdings and influences how the portfolio behaves. Tighter filters shrink the universe and can boost concentration. Looser filters broaden the pool and can bring in lower quality or less liquid names.
Market Cap Bands and Liquidity Filters
A lot of indices use buffer zones and market cap bands to cut down on unnecessary rebalancing. A small cap index might require a market cap between $300 million and $2 billion to get in, but let existing holdings stay until they fall below $250 million or rise above $2.5 billion. This tolerance band stops securities that bounce near the edge from being added and dropped over and over, which would create excess turnover and trading costs. Minimum liquidity thresholds, often expressed as a minimum ADTV or a minimum number of trading days with volume above a set level, filter out securities that would be expensive or risky to trade in size. These filters help the index stay practical for large funds to replicate and protect you from the market impact and wide bid ask spreads that come with illiquid holdings.
Evaluating Weighting Methodologies in an ETF Index

Weighting methodology decides how much of each holding the ETF must own, and it directly shapes rebalancing intensity, concentration risk, and turnover. A market cap weighted index automatically adjusts as stock prices move, needing trades only when constituents are added or removed or when weights drift far enough to hit a threshold. An equal weight index has to force every holding back to the same weight on every rebalance, creating high turnover as winners get trimmed and losers get topped up. Factor based indices rebalance according to signals like momentum scores, valuation ratios, or quality metrics, which can shift every quarter and require replacing holdings that no longer meet the factor definition.
The main weighting styles have different implications for cost and behavior. Market cap weighting concentrates the portfolio in the largest companies and keeps turnover low, but it can lead to overexposure to expensive or overvalued mega caps. Equal weighting spreads risk more evenly and can tilt the portfolio toward smaller names, but it increases trading costs because every rebalancing event means adjusting hundreds of positions back to target. Factor weighting ties holdings to quantitative screens and delivers targeted exposures, but turnover varies widely depending on how stable the factor signals are and whether the index uses buffer rules to limit churn. Smart beta strategies often combine factor tilts with modified weighting and can range from low turnover to extremely high turnover depending on the design.
- Market cap weighting keeps turnover low and implementation simple, but concentration in large winners can create risk if those companies reverse or if the market rotates away from mega caps.
- Equal weighting forces systematic rebalancing that trims winners and adds to laggards, raising turnover and trading costs while increasing exposure to smaller, potentially higher volatility names.
- Factor weighting delivers targeted exposures and can outperform when the factors work, but frequent rebalancing to maintain factor purity increases costs and tracking error if execution is imperfect.
- Fundamental weighting uses accounting metrics like revenue or dividends to set weights, which can reduce concentration but still requires periodic rebalancing and may underweight growth companies with low current dividends.
In practice, weight changes bigger than 1 percent often need staged execution over multiple days to cut market impact, while adjustments smaller than 0.25 percent are typically executed on the rebalance day itself. These thresholds come from real world execution experience and help asset managers balance tracking accuracy against trading costs. When you’re reviewing an index, check if the methodology document includes staging guidance or tolerance bands, and look for historical turnover percentages in the fund’s annual report to see how the weighting system plays out in reality.
Analyzing Rebalancing Cadence and Reconstitution Rules

Rebalancing cadence controls the tradeoff between benchmark drift and transaction costs. Frequent rebalancing keeps the index closer to its stated objective and cuts the risk that weights or constituents stray far from target, but it increases operational workload, trading costs, and the chance for arbitrageurs to front run predictable trades. Infrequent rebalancing lowers trading costs and limits turnover but allows bigger drift, which can hurt tracking accuracy, create mandate risk, and lead to sector or single stock concentration that was never intended.
Real world examples show how different indices handle this. The S&P 500 rebalances quarterly in March, June, September, and December, with changes announced ahead of time. FTSE Russell is shifting from annual reconstitution to a twice yearly schedule in 2026, with rebalances planned for June and November, a move designed to reduce drift while still controlling turnover. In March 2020, during the pandemic market crash, major index providers canceled scheduled rebalancing events to avoid forcing large trades into illiquid, volatile conditions, which caused big losses for hedge funds that had positioned to anticipate those trades. That cancellation was rare, but it shows that rebalancing schedules aren’t always rigid and extreme market stress can override normal procedures.
- Check the published rebalancing calendar for exact months and days, and confirm whether the schedule is fixed or discretionary.
- Identify the announcement to effective date lag because shorter windows give arbitrageurs less time to position and can reduce front running costs.
- Review buffer rules and tolerance bands that let weights or constituents deviate by a set percentage before triggering a rebalancing trade.
- Look for corporate action handling rules that define how the index treats mergers, spin offs, delistings, and bankruptcies between scheduled rebalances.
- Check historical exceptions by reading past reconstitution reports or provider announcements for times when rules were overridden or schedules were changed.
| Index | Typical Rebalance Months |
|---|---|
| S&P 500 | March, June, September, December |
| FTSE Russell (2026 forward) | June, November |
| Factor index (example) | Monthly or Quarterly (varies by provider) |
For more detail on global index rebalance schedules and operational workflows, see Index rebalancing: Process and best practices for asset managers.
Assessing Turnover, Trading Costs, and Liquidity Implications

Turnover measures how much of the portfolio changes over a given period, and it’s directly linked to the index methodology. Tighter eligibility rules, frequent rebalancing, and equal or factor weighting all push turnover higher. Higher turnover means more trades, and every trade has a cost: commissions, the bid ask spread, and market impact (the price movement your large order causes). When an index forces the ETF to buy or sell illiquid holdings or large quantities relative to average daily volume, those costs grow fast and eat into your returns.
- Average daily trading volume (ADTV) tells you how many shares typically change hands per day, which determines whether the ETF can execute the required trade without moving the market.
- Bid ask spread is the gap between what a buyer pays and a seller receives, and wider spreads mean higher costs on every transaction, especially for smaller or less liquid stocks.
- On book depth measures how many shares are available at or near the current price. If the required trade size exceeds normal on book depth, execution will need to walk the order book or source liquidity off exchange.
- Market impact quantifies how much the ETF’s own trading pushes the price against it, forcing the fund to buy at higher prices or sell at lower prices than the prevailing market.
- Turnover percentage from the fund’s annual report summarizes how much of the portfolio was replaced over the year. Persistently high turnover signals elevated costs.
Big weight changes over 1 percent need multi day staging to spread execution and cut impact, while changes under 0.25 percent can usually be executed on the rebalance day without major slippage. When you’re reviewing an index, calculate the required share quantities for expected additions and deletions, then compare those quantities to ADTV to estimate whether trades will need staging. If a holding has low ADTV or a wide bid ask spread and the index methodology doesn’t include liquidity buffers or phased reconstitution rules, expect higher costs and tracking error at rebalancing.
Understanding Tracking Error and Replication Approaches

Tracking error is the difference between the ETF’s return and the index return. It comes from liquidity limits, market impact, timing differences, sampling decisions, and the way corporate actions get handled. Even a well managed ETF won’t perfectly match its index because real world trading has friction. Rebalancing makes tracking error worse when the index methodology forces large, predictable trades into illiquid securities or when the fund has to execute over multiple days while the index calculation assumes instant execution at closing prices.
Replication method determines how closely the ETF can follow the index. Full replication means the fund owns every constituent in the exact weight, which cuts tracking error but can be expensive or impossible when the index includes hundreds of illiquid small caps or international securities with restricted access. Sampling uses optimization to hold a representative subset of the index, which reduces trading costs and operational complexity but introduces tracking error because the sample won’t move exactly like the full index. Synthetic replication uses derivatives like swaps to deliver index returns without owning the underlying securities, which can improve tracking in difficult markets but adds counterparty risk and may reduce transparency.
You can check tracking difference, the cumulative gap between fund and index returns over time, by comparing the ETF’s net asset value performance to the index’s published total return in the fund’s annual report or fact sheet. Consistent, small tracking differences suggest efficient execution and a sound replication method. Large or volatile tracking differences signal problems with liquidity, market impact, or methodology alignment, and they deserve more investigation before you commit capital.
Governance, Transparency, and Index Provider Quality

Transparent index providers publish full methodology documents, data source definitions, calculation inputs, timing rules, and advance notice of any methodology changes. This transparency lets asset managers predict rebalancing trades, execute efficiently, and reduce tracking error. It also cuts information asymmetry and makes it harder for arbitrageurs to exploit the fund at your expense. When a provider keeps methodology details vague, refuses to publish reconstitution calendars, or changes rules without warning, execution costs rise and trust falls.
Independent oversight and formal review cycles add another layer of quality. Reputable providers maintain index committees that meet regularly to review rules, handle edge cases, and propose methodology updates, and they publish minutes or summaries of those meetings. Predictability is a feature, not a bug. If the index has survived multiple market cycles without frequent rule changes or ad hoc exceptions, it’s more likely to remain stable and implementable going forward. Governance structure matters because poor governance opens the door to manipulation, favoritism, or reactive changes that hurt tracking and increase costs.
- Frequent methodology changes with short notice suggest instability and make it hard to forecast turnover or costs.
- Vague or missing documentation on eligibility, weighting, or reconstitution timing is a major red flag that hides implementation risk.
- Opaque data inputs or calculation methods prevent verification and make it impossible to audit whether the index is being calculated correctly or fairly.
Applying a Practical ETF Due Diligence Checklist
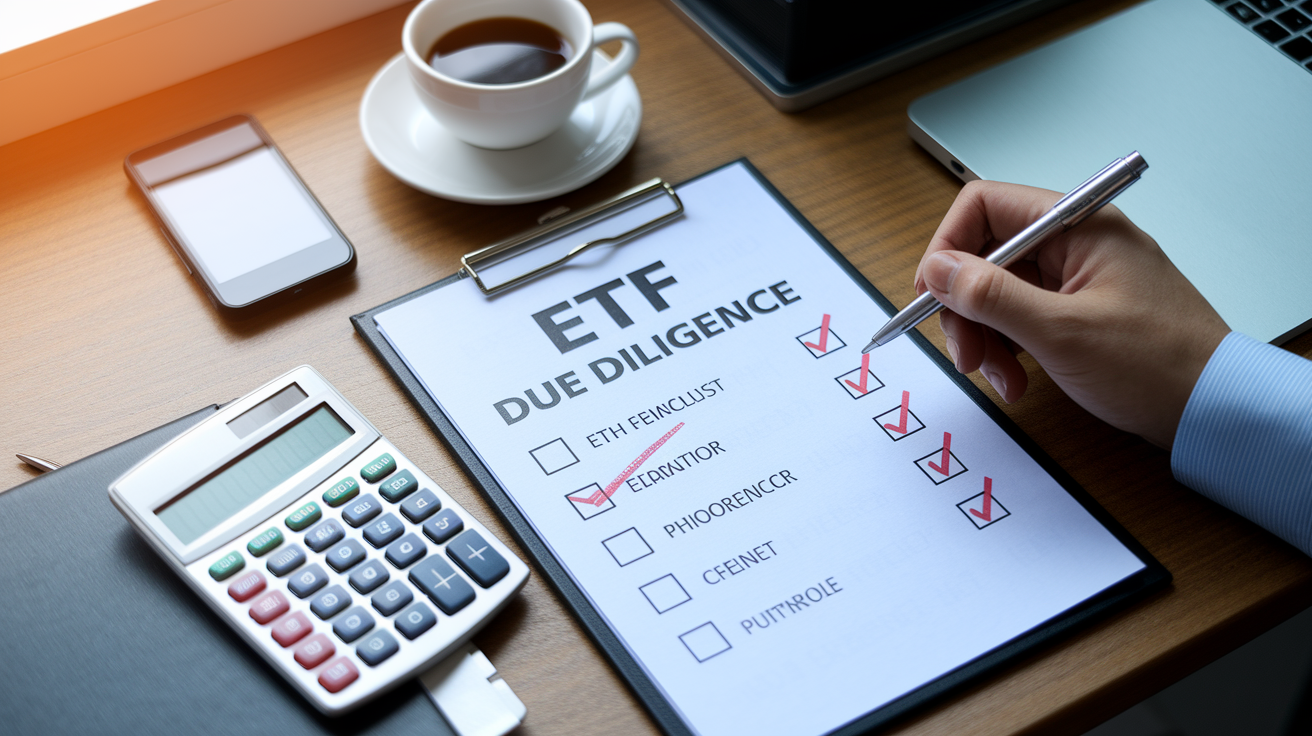
A structured checklist turns scattered information into a repeatable process you can use to evaluate any ETF before you invest. Walk through it methodically for every fund you consider, especially when comparing similar indices or choosing between providers. The goal is to spot red flags early and quantify the tradeoffs between tracking accuracy, cost, liquidity, and transparency so you can make an informed decision.
Checklist Overview
This is a step by step workflow that starts with document collection and ends with a clear understanding of the fund’s operational risk, cost structure, and rule transparency. Complete every item before making a final allocation decision.
- Grab all required documents including the ETF prospectus, statement of additional information, fund fact sheet, index methodology document, recent reconstitution reports, and regulatory filings like the most recent annual report.
- Confirm selection and eligibility rules by extracting minimum market cap thresholds, ADTV or liquidity filters, listing requirements, sector or geographic constraints, and any financial health or governance screens.
- Verify the weighting scheme to see if the index is market cap weighted, free float market cap weighted, equal weighted, fundamental weighted, or factor weighted, and note any concentration caps or buffers.
- Pull out the reconstitution and rebalancing calendar including exact effective dates, announcement dates, the frequency (monthly, quarterly, semiannual, annual), and whether the schedule is fixed or discretionary.
- Check for buffer zones, tolerance bands, and threshold rules that delay trades until deviations exceed set percentages or allow existing holdings to remain eligible even if they fall slightly below minimum criteria.
- Review historical turnover by reading the fund’s annual report for turnover percentage, number of trades, and any commentary on unusually high or low activity in the past year.
- Check the replication method by confirming whether the fund uses full replication, sampling, optimization based sampling, or synthetic replication, and understand how that choice affects tracking error.
- Evaluate liquidity and execution cost estimates by pulling ADTV, bid ask spreads, and on book depth for the largest and smallest holdings, then calculate required share quantities for expected additions or deletions to see if staging will be necessary.
- Examine tax handling and transaction cost management by reviewing how the fund manages cash flows, whether it uses in kind creation and redemption to cut taxable events, and whether historical tax distributions have been low or high relative to peers.
- Inspect tracking error and tracking difference by comparing the ETF’s historical NAV returns to the index’s published total returns over one, three, and five year periods, and investigate any periods with large deviations.
Final Words
in the action, you learned where to pull the prospectus, fact sheet, index methodology, and reconstitution reports — the documents that really matter.
You saw which rules to extract (weighting, rebalance cadence, announcement timing), how to spot red flags, and why turnover, liquidity, and governance change costs and tracking.
Use the step-by-step checklist to run one quick review. Try it on a single fund to practice how to review an etf’s index methodology and rebalancing rules, and you’ll build confidence fast.
FAQ
Q: What is the 7% rule in ETF?
A: The 7% rule in ETF means you rebalance when an asset’s allocation drifts about 7 percentage points from its target, helping control risk and restore your intended mix while limiting trading.
Q: What is the 3 5 10 rule for ETFs?
A: The 3 5 10 rule for ETFs refers to choosing drift triggers—rebalance at 3%, 5%, or 10% deviations—where lower thresholds keep your mix tighter but raise trading and tax costs.
Q: What is the 5 25 rule for rebalancing?
A: The 5 25 rule for rebalancing means use a 5 percentage‑point absolute drift or a 25% relative change from an original weight as a trigger to rebalance, balancing tracking and trading costs.
Q: What did Warren Buffett say about ETFs?
A: Warren Buffett said most investors should buy low‑cost, broad market index funds (like an S&P 500 fund), because they’re simple, cheap, and generally beat actively managed approaches over time.
