

What if that tiny 0.5% fee costs you six figures over 30 years?
Expense ratios quietly chip away at returns because the fee comes out of the fund and can’t compound.
This post shows how to judge if a fee is fair and how much it will matter for your timeline.
You’ll get where to find the net ratio, what to compare (index, tracking error, trading cost, fund size), and a simple checklist to run the numbers yourself.
Understanding ETF Expense Ratios and Their Long‑Term Impact
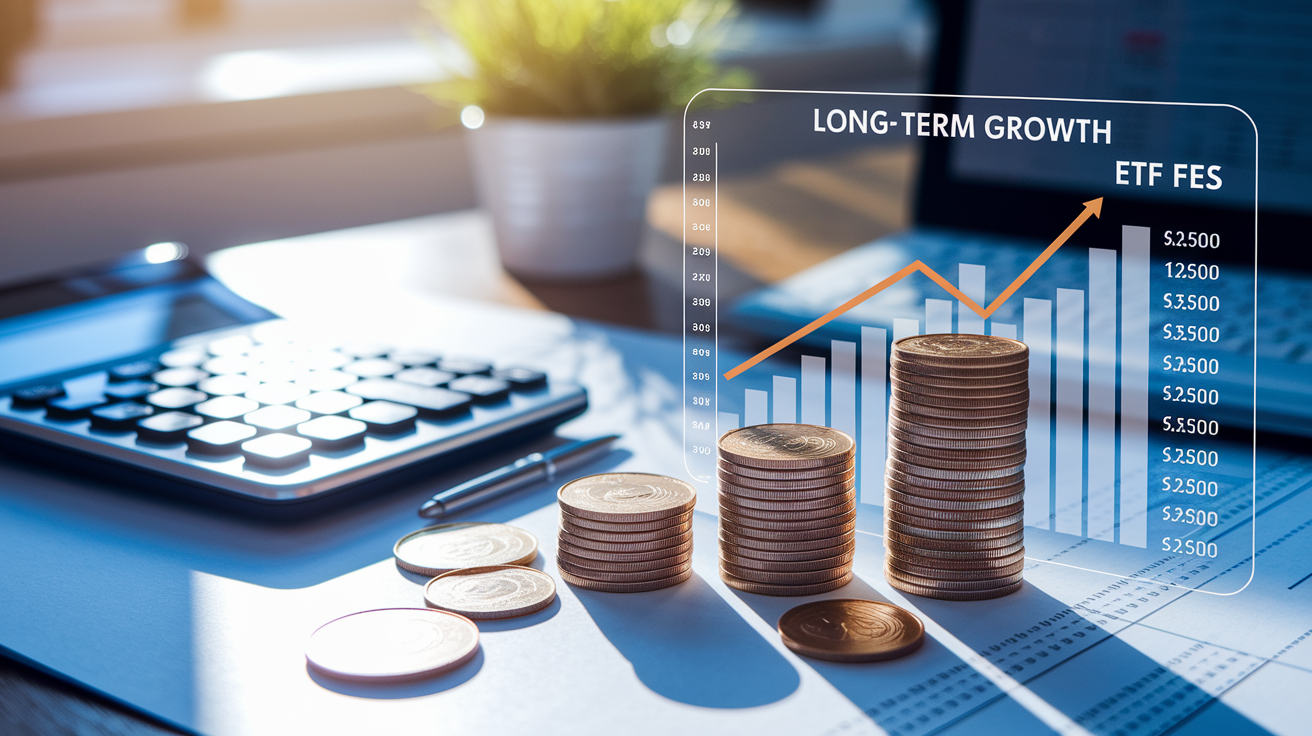
An ETF expense ratio is what it costs to run the fund each year, shown as a percentage of what you’ve got invested. You put $10,000 into an ETF charging 0.20%? That’s $20 a year. The fund takes it straight out of assets, so you’re not writing checks. It just quietly chips away at your returns.
Small fee differences turn into big money over time. The gap between 0.05% and 0.50% looks like nothing today. But stretch that out 30 years and you’re talking tens of thousands of dollars less in your account. Why? Because every dollar you pay in fees can’t grow and compound.
Passive ETFs tracking major indexes usually run cheap, somewhere between 0.03% and 0.20%. They don’t need much hands-on work. Active ETFs, where managers pick stocks and trade more often, typically charge 0.40% to 1.00% or higher. Whether a fee makes sense depends on what you’re actually getting.
Here’s what determines if an expense ratio is fair:
- What index or strategy it follows. Broad market stuff should be dirt cheap. Niche or active plays often cost more.
- How well it tracks its benchmark. If the ETF sticks close to the index, small fee differences matter a lot. Big tracking errors can wipe out the benefit of a low fee.
- How easy it is to trade. Wide bid‑ask spreads can eat up what you saved on a low expense ratio, especially if you’re in and out a lot.
- How much money the fund manages. Smaller ETFs sometimes charge more to cover their costs, or they might be at risk of shutting down.
- Fee waivers that don’t last. Some ETFs promote low fees that expire later. Check the fine print.
Let’s run the numbers. You invest $50,000 now and add $500 every month. You’re expecting 7% returns before fees. With a 0.05% expense ratio, your net return is 6.95% a year. After 30 years you’ve got around $810,000. With a 0.50% ratio, you’re netting 6.50% and end up with about $719,000. That extra 0.45% in fees cost you $91,000 over three decades.
What an ETF Expense Ratio Includes
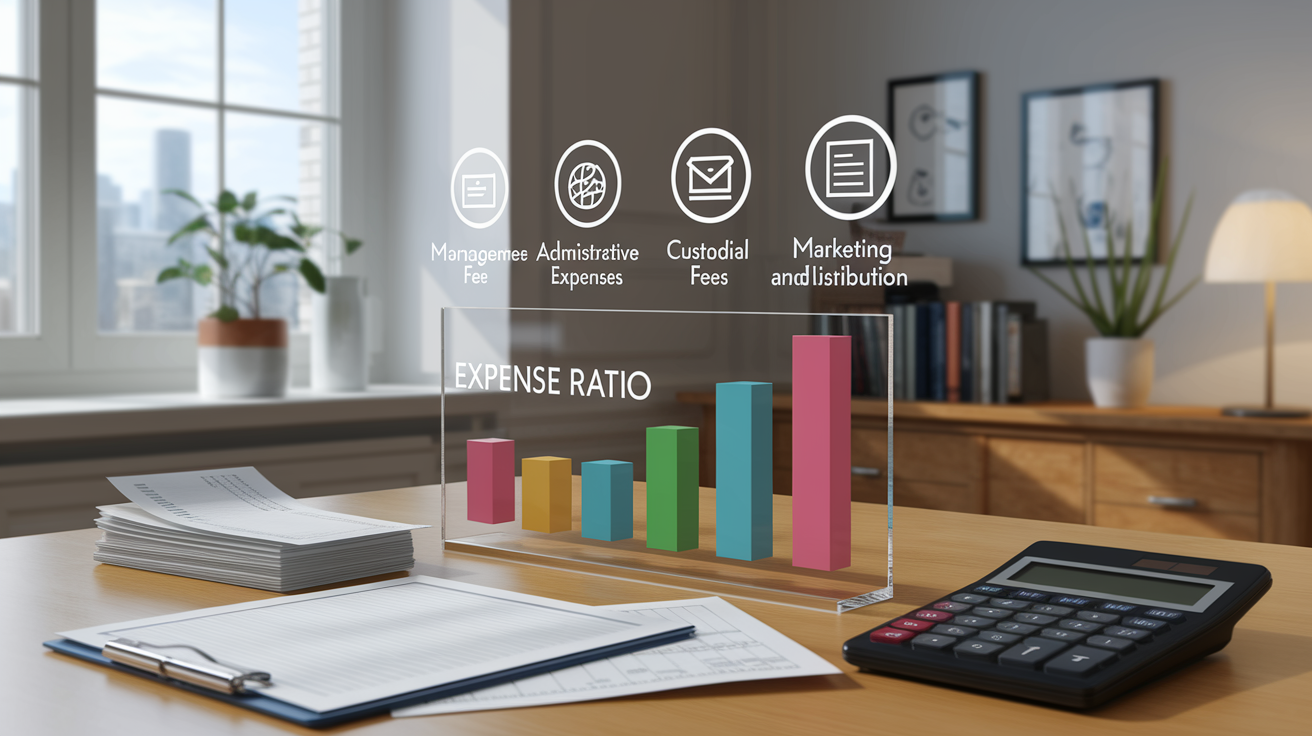
The expense ratio covers what it takes to keep the fund running. The biggest chunk is the management fee, which pays the people deciding what to buy and sell. For passive index ETFs this fee is low because the work is mostly automated, just following index rules.
Admin costs include recordkeeping, legal stuff, accounting, regulatory filings. Custodial fees go to the bank holding the fund’s assets. Marketing and distribution costs (sometimes called 12b‑1 fees) pay for ads and broker commissions. 12b‑1 fees show up less in ETFs than mutual funds.
All these expenses get added up and divided by the fund’s average assets to give you the published expense ratio. The fund takes this percentage from returns automatically. You never see a bill.
Main categories inside an expense ratio:
- Management fee. Pays the team picking securities and running the portfolio.
- Administrative expenses. Accounting, legal work, compliance.
- Custodial fees. Pays whoever’s safeguarding the fund’s assets.
- Marketing and distribution costs. Promotional work and sometimes broker pay (more common in mutual funds).
Where to Find an ETF’s Expense Ratio
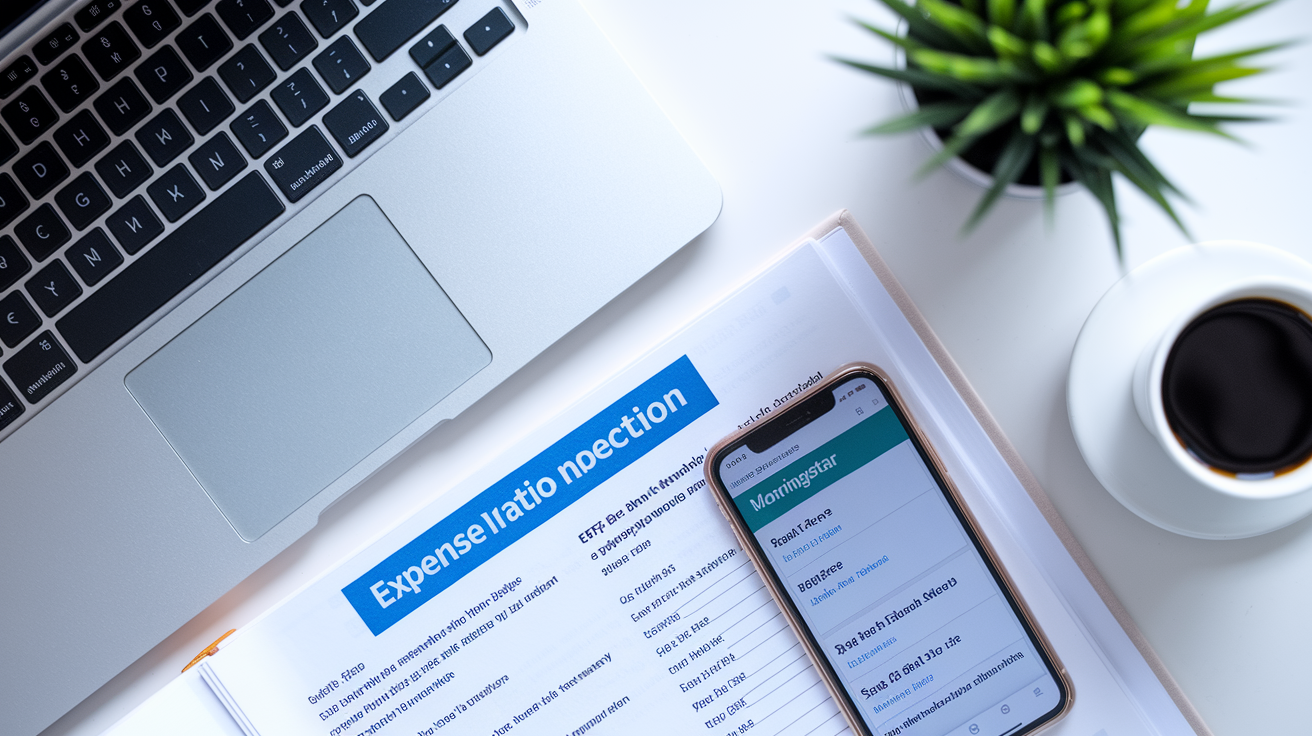
The expense ratio lives in the prospectus, a legal doc filed with regulators and posted on the ETF issuer’s site. Most issuers also put out a one or two page fact sheet with the expense ratio, recent performance, top holdings, other key info. The fact sheet is your fastest way to confirm the current fee.
You can also pull expense ratios from third party platforms and brokerage screeners. Morningstar, Yahoo Finance, your broker’s research tools, they all show expense ratios next to other fund stats. These sites grab data from regulatory filings and fund websites, so they’re usually right. Still, double check the number against the official prospectus before you commit.
Best places to find expense ratio info:
- Prospectus and fact sheet from the issuer’s website.
- Regulatory filings like the summary prospectus or annual report.
- Third party platforms such as Morningstar, ETF.com, or your brokerage’s screener.
Typical Expense Ratio Ranges by ETF Type
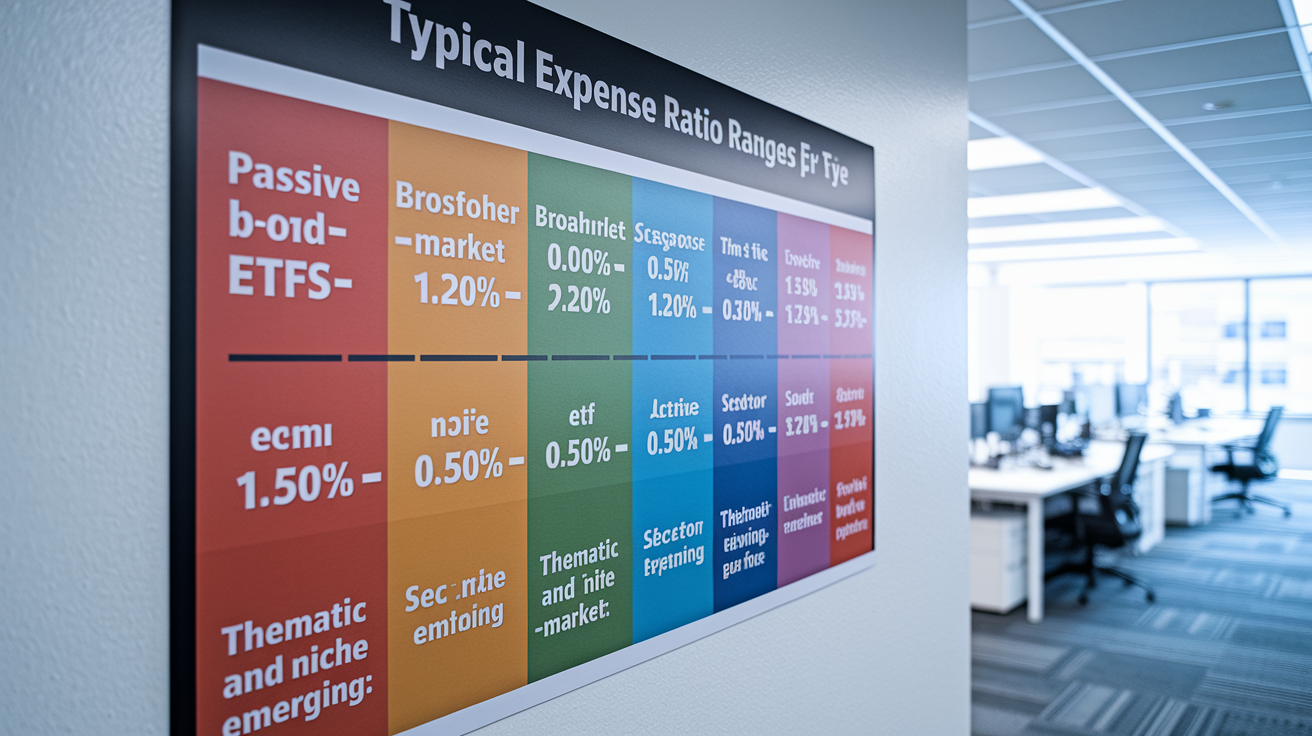
Passive ETFs tracking big indexes like the S&P 500 or total U.S. market usually charge between 0.03% and 0.20%. The cheapest funds in this group go as low as 0.02% or 0.03%. Older or smaller funds might run 0.10% to 0.15%. These funds need minimal management since they just copy an index.
Active ETFs have managers making calls based on research and forecasts. They usually charge 0.40% to 1.00% or more, reflecting the cost of active work and the potential for beating the market (which isn’t guaranteed). Sector and thematic ETFs, focused on narrow slices like tech, clean energy, or robotics, often carry higher fees because they need specialized research and rebalance more often.
| ETF Type | Typical Range | Notes |
|---|---|---|
| Passive broad‑market ETFs | 0.03%–0.20% | Lowest cost; follows major indexes with minimal trading. |
| Active ETFs | 0.40%–1.00%+ | Higher fees for active management and research. |
| Sector and niche ETFs | 0.15%–0.60% | Specialized strategies and smaller universes raise costs. |
| Thematic and emerging‑market ETFs | 0.30%–0.75% | Complex indexes or international holdings increase fees. |
How Expense Ratios Influence Net Returns Over Time
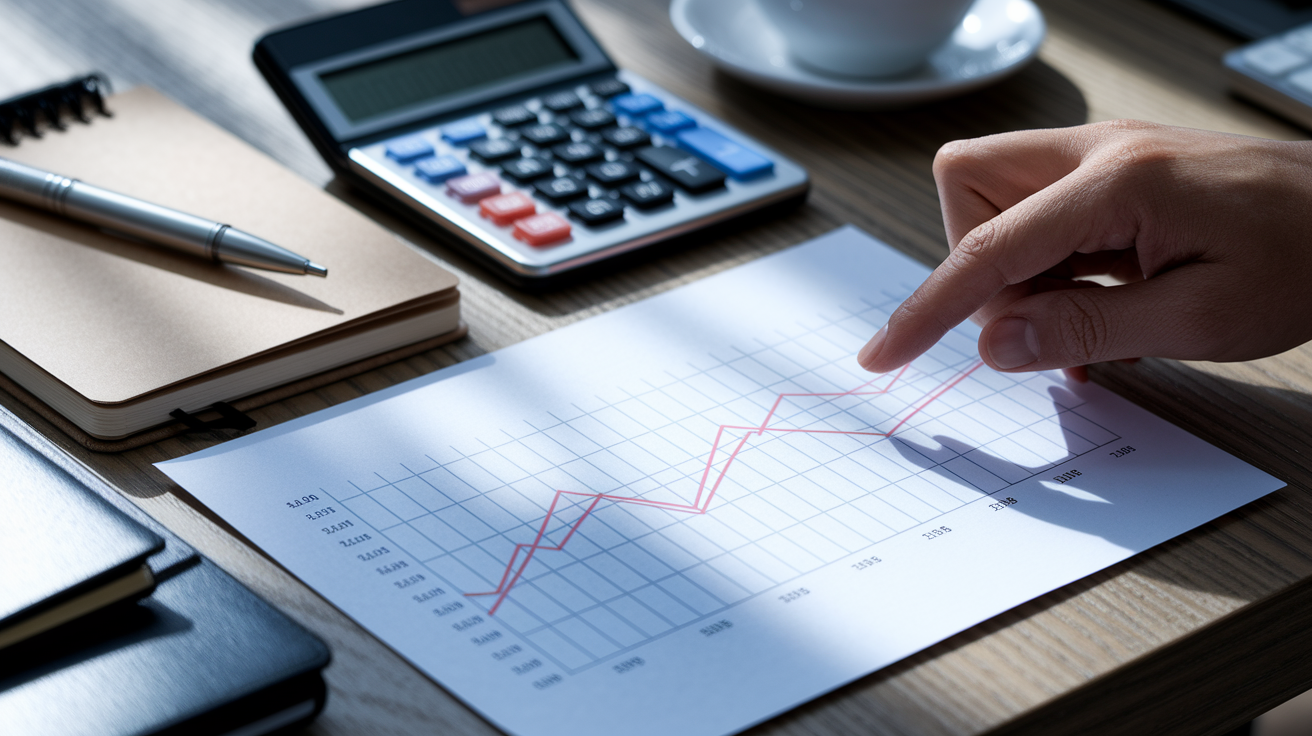
Every year the expense ratio takes a small slice off your return. Doesn’t feel like much in year one. Compound it over 10, 20, 30 years and the drag becomes real. The money you lose to fees each year can’t grow, so the true cost is bigger than the annual percentage looks.
Say you’ve got two ETFs tracking the same index, both delivering 8% gross return before fees. ETF A charges 0.10%, ETF B charges 0.60%. Start with $100,000. After 10 years ETF A hits about $214,400, ETF B hits about $205,800. That’s $8,600 difference. After 20 years the gap widens to $36,500, ETF A at $459,600, ETF B at $423,100. After 30 years the difference is $86,000. ETF A ends at $983,600, ETF B at $897,600. That half percent fee difference compounds into nearly 9% less wealth over three decades, even though both funds delivered identical gross performance.
Comparing Expense Ratios Across Similar ETFs

When you compare expense ratios, make sure you’re comparing ETFs with the same or very similar exposure. A broad U.S. stock market ETF and a small cap value ETF aren’t comparable. They hold different stocks and carry different risks. Compare funds tracking the same index or same asset class and region.
Use screening tools on your brokerage platform or third party sites to filter by asset class, index tracked, expense ratio. Sort by fee and look at the top few funds. Confirm they all have similar holdings, trading volume, assets under management. A rock bottom fee on a tiny, illiquid fund might cost you more in trading spreads than you save in annual fees.
Key comparison points:
- Index or benchmark. Confirm both ETFs track the same or nearly identical index.
- Assets under management and daily volume. Bigger, more liquid funds usually have tighter bid‑ask spreads.
- Tracking error history. Lower tracking error means the fund sticks closer to its benchmark, making expense ratio differences more important.
Step‑by‑Step Checklist for Evaluating an ETF’s Expense Ratio
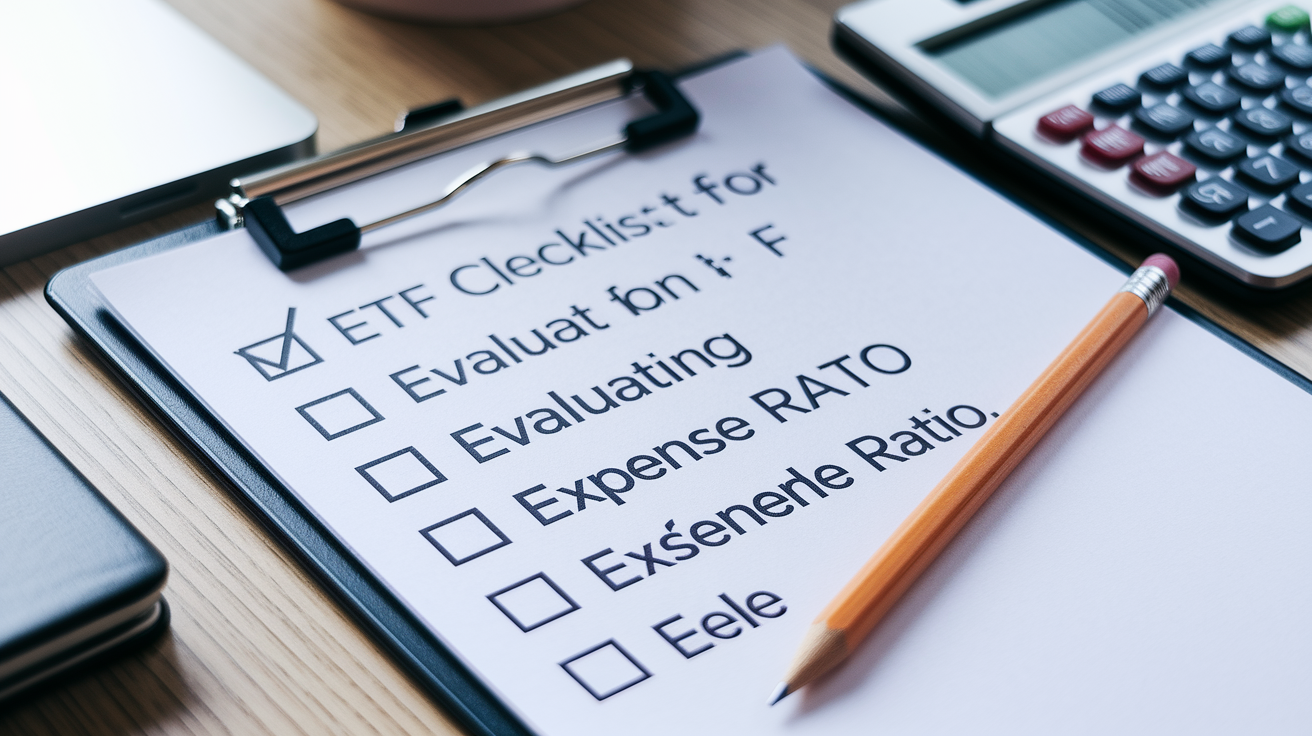
A simple checklist keeps your evaluation steady and helps you catch red flags before you invest. Run through these steps whenever you compare ETFs or review what you already hold.
-
Find the net expense ratio in the prospectus or fact sheet. Note the effective date and any temporary fee waivers that’ll expire.
-
Identify the benchmark or index the ETF tracks. Confirm it matches the exposure you want so you’re comparing the right things.
-
Check assets under management and average daily trading volume. Aim for at least $100 million in assets and consistent daily volume above 100,000 shares for decent liquidity.
-
Review the fund’s tracking error over one, three, five years if you can. Look for consistent, low deviation from the index, typically under 0.20% for broad passive ETFs.
-
Calculate your expected annual cost. Multiply your planned investment amount by the expense ratio. Compare that dollar figure to similar funds.
-
Add estimated trading costs. Check the typical bid‑ask spread on your brokerage platform or financial data site. Multiply by your trade size to estimate the one time cost of getting in or out.
-
Compare total cost of ownership. Add the annual fee and estimated trading cost, then decide whether a slightly higher expense ratio is worth it for better tracking, tighter spreads, or other quality factors.
Final Words
in the action, you learned what an ETF expense ratio is, which costs it includes, where to find the number, typical ranges by fund type, how fees eat into returns over decades, and how to compare similar ETFs fairly.
Use the step-by-step checklist to run a quick projection, compare funds with the same exposure, and favor the lower fee when everything else matches.
If you want a clear next step, try a 10- or 20-year calculation — that’s exactly how to evaluate an etf’s expense ratio and impact. Small, steady checks now can really pay off.
FAQ
Q: What is the 7% rule in ETF?
A: The 7% rule, 3‑5‑10 rule, and 15×15×15 are informal heuristics about ETF fees, fee impact, or holding time. They vary, so prefer clear benchmarks: passive ~0.03–0.20%, active often 0.40–1.0%.
Q: What’s a good expense ratio for an ETF?
A: A good expense ratio for an ETF is generally below 0.20%, with many broad passive funds under 0.10%. Lower fees keep more of your returns, but also check index exposure and liquidity.

