

Think low fees mean an ETF is cheap to trade?
Not always.
Hidden costs from liquidity and the bid-ask spread can add up fast, especially if you trade often or in bigger sizes.
This step-by-step guide shows exactly what data to check: Level I quotes, Level II depth, iNAV, spreads, and average daily volume, and how to turn them into a simple number you can use.
Use it to estimate execution cost, decide whether to slice an order or use a limit price, and avoid surprise slippage.
Core Steps to Evaluate ETF Liquidity and Bid‑Ask Spread Effectively

ETF liquidity determines how much it costs you to get in and out of a position. Even a fund with a low expense ratio can turn expensive if the bid-ask spread is wide or the market moves against you while your order fills. Checking liquidity upfront helps you avoid surprise costs that eat into returns, especially if you trade often or in bigger sizes.
You’ll need data from three places. Level I quotes show the current bid and ask. Level II (the order book) reveals the sizes available at each price and how deep the market runs beyond the top quote. And intraday NAV, or iNAV, tells you whether the ETF is trading close to the actual value of what it holds. Looking at all three before you place an order lets you estimate your execution cost and decide if you should wait, slice your order, or stick with a limit price.
Liquidity isn’t about one magic number. Spreads, volume, what the fund owns, and the creation/redemption process all work together to determine how smoothly your trade settles and how much you pay for that smoothness. The steps below walk you through each piece so you can make a smarter choice.
-
Pull the current bid and ask from your broker or market-data feed. Write down the bid price, the ask price, and the size at each. If you have Level II access, grab the next few price levels too.
-
Calculate the absolute spread and the midpoint. Spread = Ask − Bid. Midpoint = (Bid + Ask) / 2. For example, if Bid = $100.05 and Ask = $100.15, the spread is $0.10 and the midpoint is $100.10.
-
Turn the spread into a percentage. Spread% = (Ask − Bid) / Midpoint × 100. In the example, $0.10 / $100.10 × 100 ≈ 0.10%. This percentage makes it easier to compare ETFs trading at different prices. How to Calculate the Bid‑Ask Spread
-
Check average daily volume over the past 30 or 90 days. Look for ADV in shares, then multiply by the average price to get dollar volume. An ETF with ADV above 1,000,000 shares is highly liquid. Below 100,000 shares means thin trading and higher execution risk.
-
Review the liquidity of the top 5 to 10 underlying holdings. If those securities trade thinly or carry wide spreads themselves, the ETF spread will widen when you try to move size. Bond funds, small-cap exposures, and emerging-market plays often hold illiquid stuff underneath.
-
Confirm creation/redemption activity and the number of authorized participants. Check the prospectus or fund disclosures for creation unit size (often 25,000 to 100,000 shares) and whether multiple APs are involved. Regular creation and redemption keep the ETF price close to NAV and tighten spreads.
-
Compare your intended order size to ADV. If your order is larger than 1 to 5% of ADV, expect it to move the market and increase your cost. Plan to slice the order or use a VWAP algo to reduce impact.
This process gives you a complete picture of execution quality before you commit capital. Following it every time helps you dodge costly surprises and pick the right order type and timing.
Key ETF Bid‑Ask Spread Metrics to Review Before Trading

The quoted spread you see on your screen is only the starting point. Real execution costs depend on whether you cross the spread, how the market moves while your order works, and whether the ETF is trading at a premium or discount to NAV. Understanding each metric helps you estimate your total cost and compare funds side by side.
Traders and market makers track several versions of the spread. The quoted spread is what you see in the order book right now. The effective spread measures what you actually paid relative to the midpoint when you traded. The realized spread captures the price you paid compared to where the ETF traded a few seconds or minutes later. Each one tells you something different about market quality and how fair your execution was.
-
Quoted spread (absolute). This is Ask − Bid in dollars. A quoted spread of $0.10 means you lose ten cents per share if you buy at the ask and immediately sell at the bid. It’s the raw cost of immediacy.
-
Quoted spread percentage. Spread% = (Ask − Bid) / Midpoint × 100. This normalizes the spread across different ETF prices. A $0.10 spread on a $25 ETF is 0.40%, while the same $0.10 on a $100 ETF is only 0.10%.
-
Spread in basis points. Basis points = Spread% × 100. Institutional traders often quote spreads this way. A spread of 0.10% equals 10 basis points. Use these benchmarks: under 5 bps is tight, 5 to 20 bps is acceptable, over 20 bps is wide, and above 50 bps is a red flag.
-
Effective spread. Effective spread = 2 × |Trade Price − Midpoint at Execution|. If you bought at $100.12 when the midpoint was $100.10, your effective spread is 2 × ($100.12 − $100.10) = $0.04 per share. This shows your actual crossing cost and can be better or worse than the quoted spread, depending on price improvement or market impact.
-
Realized spread. This measures how the price moved after your trade. If you bought at $100.12 and the midpoint five minutes later is $100.09, part of your cost was adverse selection (you bought just before a price drop). Realized spread helps you understand whether you paid for information or just for liquidity.
These metrics work together to reveal the full picture of your trading costs. A tight quoted spread doesn’t mean much if the order book is thin and your order moves the price. Always check effective and realized spreads over a sample of recent trades to see how the ETF behaves under normal and stressed conditions.
Using Volume and Average Daily Volume to Assess ETF Liquidity
Volume tells you how much interest exists in an ETF on a given day, but average daily volume smooths out one-off spikes and gives you a baseline for planning. If an ETF trades 50,000 shares per day and you want to buy 10,000 shares, your order represents 20% of normal daily flow. Expect the market to notice and adjust the price before you finish.
Calculate ADV over the past 30, 60, or 90 days. Use the longer window if the fund is new or if you see erratic day-to-day swings. ADV in shares is useful, but ADV in dollars (shares × average price) helps you compare funds at different price points. A $200 ETF trading 50,000 shares per day moves $10 million in value. A $25 ETF trading 50,000 shares moves only $1.25 million. The dollar figure matters more for market impact.
| ADV Range (Shares) | Liquidity Level | Typical Spread Behavior |
|---|---|---|
| >1,000,000 | Highly liquid | Tight spreads, usually under 10 bps; minimal market impact |
| 100,000–1,000,000 | Moderate | Acceptable spreads, 5 to 20 bps; watch order size vs ADV |
| <100,000 | Thin | Wide spreads often above 20 bps; high execution risk and market impact |
Before placing a trade, compare your order size to ADV. A rule of thumb is to keep single orders below 5 to 10% of ADV so you don’t move the market. If you need to trade a larger block, slice the order over multiple intervals or use a participation or VWAP algorithm to blend into the natural flow. Ignoring this can double or triple your effective spread, especially in thinly traded funds.
Evaluating Underlying Asset Liquidity for Accurate ETF Liquidity Assessment

An ETF is only as liquid as the basket of securities it holds. If the fund owns thinly traded small-cap stocks, illiquid corporate bonds, or emerging-market equities that trade on foreign exchanges with limited hours, the ETF spread will reflect that friction. Market makers and authorized participants price the cost of hedging or assembling the basket into the bid-ask spread you see.
Check the fund’s holdings file or use a portfolio analytics tool to pull the top 10 or 20 positions by weight. Look up each security’s average daily volume and typical bid-ask spread. If half the basket trades fewer than 100,000 shares per day or shows spreads wider than 20 basis points, expect the ETF spread to widen when you try to move size. This effect is strongest in bond ETFs, where many underlying bonds trade once a week or less and dealer spreads can exceed 50 to 100 basis points.
Things to inspect in the underlying holdings:
Average daily volume of each top holding. Compare it to the ETF’s ADV and your intended order size. If the top holdings are less liquid than the ETF itself, you’re relying entirely on the creation/redemption mechanism to keep spreads tight.
Bid-ask spreads of the underlying securities. Add up the weighted-average spread of the basket to estimate the minimum cost an AP faces when creating or redeeming shares. That floor becomes the ETF’s spread floor.
Trading frequency and turnover. Bonds and small-cap foreign stocks often trade infrequently. If a security last traded hours or days ago, the posted quote might be stale and the real spread much wider.
Currency conversion and cross-border settlement costs. International ETFs add foreign exchange spreads and settlement lags. Some markets charge transaction taxes or have capital controls that increase round-trip costs by 0.10 to 0.50%.
Market hours and time-zone overlap. If an ETF holds European stocks and you trade during U.S. hours, the underlying market is closed. Market makers must use futures or ADRs to hedge, which widens the spread.
Sector concentration and correlation. A diversified basket of liquid stocks is easier to hedge than a concentrated bet on three illiquid names. High correlation among holdings reduces hedging complexity and can tighten spreads.
Underlying liquidity predicts how the ETF will behave under stress. In a market sell-off, thinly traded holdings gap wider first, and the ETF spread follows immediately. Always cross-check the basket before assuming a tight quoted spread will hold when you need it most.
Examining Creation/Redemption Mechanics to Understand Deep ETF Liquidity

ETF liquidity has two layers: the secondary market where retail and institutional investors trade shares, and the primary market where authorized participants create and redeem large blocks called creation units. The primary market is what allows even low-volume ETFs to trade near fair value. When the ETF price drifts above NAV, an AP can buy the underlying basket, deliver it to the fund, and receive new ETF shares to sell into the market. This arbitrage keeps premiums and discounts small and prevents the ETF from decoupling from its holdings.
Creation unit sizes typically range from 25,000 to 100,000 shares, with 50,000 shares being common. A smaller creation unit makes it easier for APs to arbitrage small mispricings, which tightens spreads. A large creation unit (say 200,000 shares) raises the capital threshold and can leave the ETF trading at a persistent premium or discount if underlying liquidity is weak. Check the prospectus or the fund’s website for the exact creation unit size and whether the fund allows in-kind or cash creations.
Points to verify for healthy primary-market liquidity:
Number of authorized participants. A fund with multiple APs (often five or more large broker-dealers) will have tighter spreads because competition among APs reduces arbitrage profit margins. ETF Liquidity Considerations
Frequency of creations and redemptions. Look at the fund’s daily shares-outstanding history. Regular changes indicate active AP participation. A flat line for weeks suggests APs aren’t engaged, and spreads may widen.
Premium/discount behavior. Calculate the average intraday premium or discount to NAV over the past 30 days. Persistent deviations above 0.25 to 0.50% signal that the creation/redemption mechanism isn’t working smoothly. Possible causes include illiquid underlying assets, high transaction costs, or operational constraints.
Basket turnover and liquidity. APs must trade the underlying basket to create or redeem. If the basket is hard to assemble (illiquid bonds, foreign stocks with settlement delays), APs will demand a wider spread to compensate for execution risk.
You can confirm healthy primary liquidity by reviewing the fund’s quarterly reports, which often disclose AP names and creation/redemption statistics. If the fund shows regular creations, multiple APs, and a tight average premium/discount, you can trade with confidence that deep liquidity exists beyond what the secondary-market volume suggests.
Order Book, Market Depth, and Level II Data for Advanced ETF Liquidity Analysis

The best bid and ask you see in a Level I quote are just the top of the order book. Level II data reveals the full stack of buy and sell orders waiting at each price level, showing you how much size is available and how far the price will move if you sweep the book. A tight spread with only 100 shares displayed at the best bid and ask is a trap. Your 5,000-share market order will blow through those 100 shares and keep walking up the ladder, costing you much more than the quoted spread.
Market depth measures the total volume of orders near the best price. Professional traders look at cumulative size within a few cents or basis points of the midpoint. If the order book shows 50,000 shares bid within 10 cents of the best bid and 50,000 shares offered within 10 cents of the best ask, the market can absorb normal-sized retail and small institutional orders without moving the price. If the book shows only 500 shares on each side, you’re trading in a thin market and should expect high impact.
| Displayed Size at Best Bid/Ask | Interpretation | Impact on Spread |
|---|---|---|
| Under 1,000 shares | Very thin market; likely passive quotes | Market orders will walk the book; expect wide effective spread |
| 1,000 to 10,000 shares | Moderate depth; OK for small retail orders | Spreads widen on larger orders; use limit orders |
| Over 10,000 shares | Deep market; active market-making | Tight effective spread; low market impact for typical order sizes |
Level II also shows you time and sales data, which lists every trade that printed along with the price, size, and timestamp. Watching time and sales for a few minutes reveals the rhythm of the market. If you see frequent small trades and the spread stays stable, liquidity is good. If trades are sparse and the spread jumps around, wait for a calmer window or use a limit order to control your entry price. Combining Level II depth with time and sales gives you a real-time liquidity picture that static ADV figures can’t capture.
Calculating Trade Cost, Slippage, and Realized Spread for ETFs
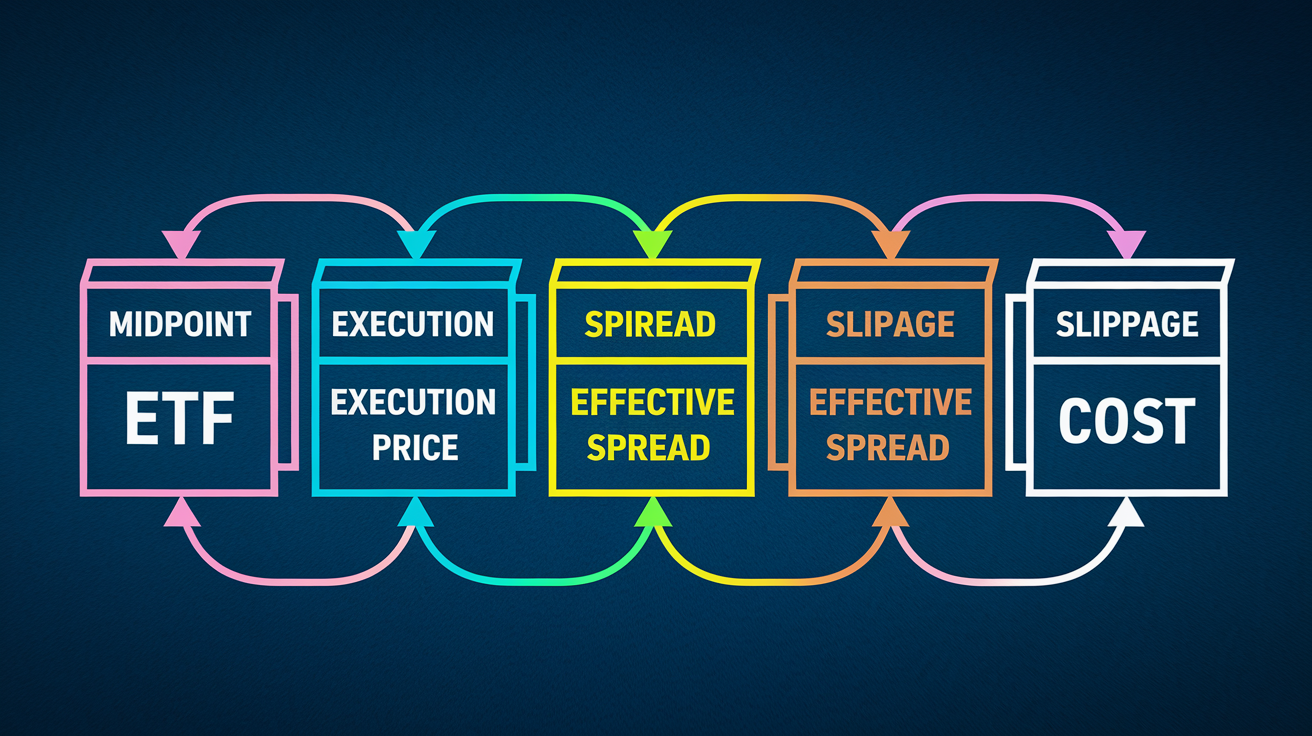
The round-trip cost of trading an ETF is roughly equal to the spread. If you buy at the ask and later sell at the bid, you give up the full spread. For example, with a spread of $0.10, buying 1,000 shares at $100.15 and selling at $100.05 costs you $100 in total, or $0.10 per share. That $0.10 represents 0.10% of the midpoint, so your round-trip cost is 10 basis points.
To measure your actual execution quality, compare your fill price to the midpoint at the time of execution. If the midpoint was $100.10 and you bought at $100.15, you crossed half the spread and paid $0.05 per share in immediate cost. The effective spread formula captures this: Effective Spread = 2 × |Execution Price − Midpoint|. In this case, 2 × ($100.15 − $100.10) = $0.10, which matches the quoted spread if you crossed it fully. If you got price improvement and filled at $100.12, your effective spread drops to 2 × $0.02 = $0.04.
Slippage adds to your cost when the market moves while your order is working. Suppose you placed a large order and the midpoint drifted from $100.10 to $100.20 by the time your final shares filled. Your average fill might be $100.18, giving you slippage of $0.08 per share relative to the starting midpoint. Measuring slippage against VWAP (the volume-weighted average price over a set interval) or against the arrival price (the midpoint when you first sent the order) helps you judge whether you executed well or whether your order moved the market.
Practical metrics to track after each trade:
Arrival cost. Compare your average fill to the midpoint when you first sent the order. This measures total cost including market impact and timing.
VWAP comparison. If you used a VWAP algorithm or traded over several minutes, compare your fill to the VWAP over that same period. Beating VWAP means you executed better than a passive slice.
Spread capture. Calculate what percentage of the spread you paid. Filling at the midpoint means zero spread cost. Filling at the ask means you paid the full half-spread. Consistent spread capture above 50% suggests you should use more limit orders.
Implementation shortfall. This combines slippage, spread cost, and any opportunity cost from delayed execution. It’s the difference between the theoretical price (midpoint at decision time) and your final average fill, expressed in basis points or dollars.
Tracking these metrics over time reveals patterns. If your effective spread is consistently wider than the quoted spread, you’re crossing too aggressively or trading at bad times. If your slippage is high, you’re moving the market and need to slice orders more finely or use algos. Measuring real execution costs turns trading from guesswork into a repeatable process.
Best Practices for Reducing ETF Bid‑Ask Spread Costs

The simplest way to cut spread costs is to avoid crossing the full spread. Use a limit order at or near the midpoint and wait for the market to come to you. If the bid is $50.00 and the ask is $50.02, place a limit buy at $50.01. You might not fill immediately, but if you do fill, you saved half the spread compared to a market order. In liquid ETFs during normal hours, this tactic works most of the time.
Timing matters almost as much as order type. The first 15 minutes after the market opens (9:30 to 9:45 ET for U.S. equities) and the last 15 minutes before the close (3:45 to 4:00 PM ET) see the widest spreads and highest volatility. Market makers widen quotes to protect against information and positioning risk, and order imbalances push prices around. Trading between 10:00 AM and 3:30 PM typically offers the tightest spreads and deepest liquidity, especially for U.S. equity ETFs. For international funds, trade during the overlap when both the U.S. market and the relevant foreign market are open.
Five actionable tactics to lower execution costs:
Use limit orders or marketable limit orders instead of market orders. Set your limit at the midpoint or one tick through it. This controls your maximum cost and often gets you price improvement.
For large orders, slice into smaller pieces and use VWAP or TWAP algorithms. Participation algorithms (also called POV for percentage-of-volume) blend your order into the natural flow and reduce market impact. Target 10 to 30% participation to stay under the radar.
Place orders during the most liquid hours. Avoid the open, the close, and low-volume midday periods. Check the ETF’s intraday volume pattern and trade when ADV peaks.
Monitor the order book and adjust your limit price as the market moves. If the midpoint shifts, update your order to stay competitive without chasing. Patience often saves you several basis points.
For very thinly traded ETFs or large institutional blocks, contact your broker’s ETF trading desk or an authorized participant. They can facilitate a block cross at or near NAV, bypassing the secondary market entirely and eliminating the spread cost.
Time-of-day effects are real. Studies show that ETF spreads can be 50 to 100% wider in the first and last 15 minutes compared to mid-day. If you trade a $50 ETF with a mid-day spread of $0.02 (0.04%) and an opening spread of $0.05 (0.10%), waiting an extra 20 minutes saves you $30 per 1,000 shares. Over time and across multiple trades, that adds up.
Warning Signs and a Pre‑Trade Checklist for ETF Liquidity Assessment
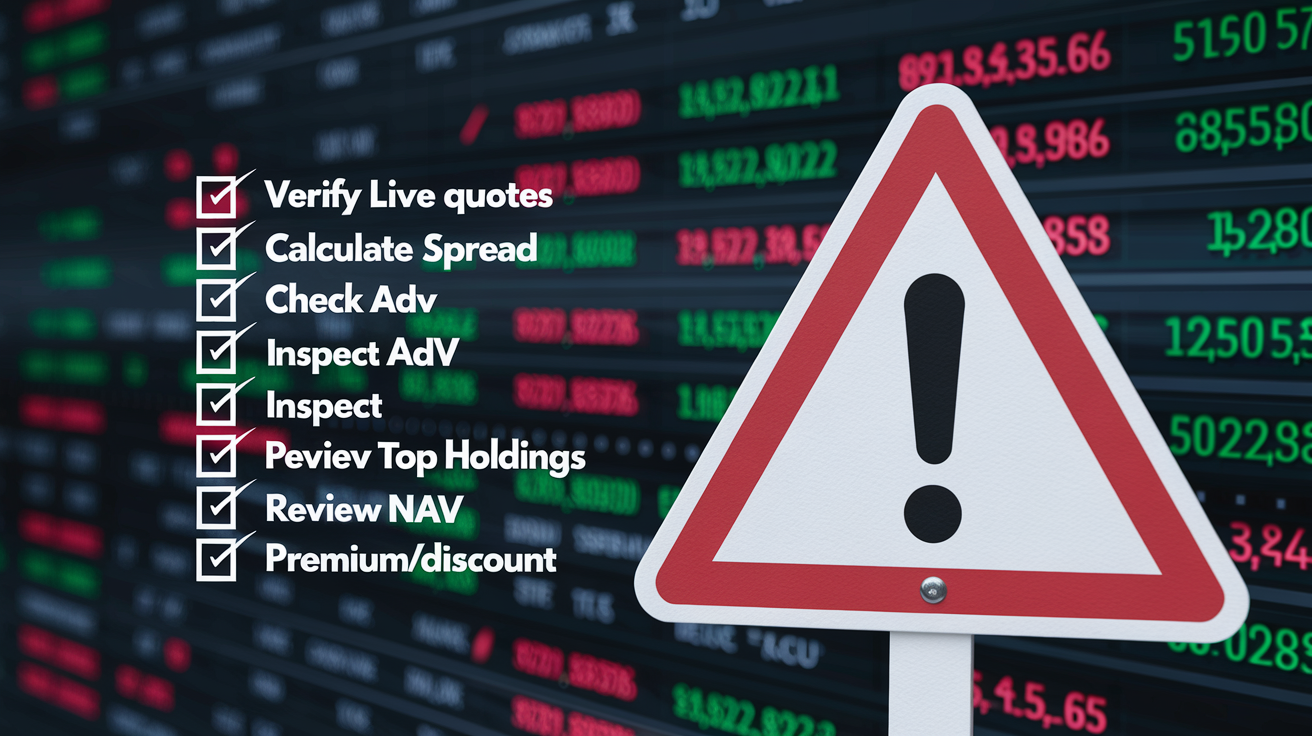
Certain patterns signal trouble before you commit capital. A quoted spread above 0.5% should make you stop and investigate. ADV below 100,000 shares combined with a wide spread means you’re trading in a market with little interest and high friction. Persistent premiums or discounts to NAV above 0.25 to 0.50% suggest the creation/redemption mechanism is strained, either because the underlying basket is hard to trade or because authorized participants are pulling back.
Use this checklist every time before you place a material trade:
-
Verify the current bid, ask, and midpoint. Confirm the data is live and not delayed. Stale quotes lead to bad decisions.
-
Calculate spread percentage and convert to basis points. Compare to your threshold. If the spread is above 20 bps for an equity ETF or 50 bps for a bond ETF, dig deeper.
-
Check 30-day and 90-day average daily volume in shares and dollars. Make sure your order size is well below 5% of ADV to avoid market impact.
-
Inspect the displayed size at the best bid and ask. If the size is under 500 to 1,000 shares, the market is very thin. Consider waiting or using a more liquid alternative.
-
Review the top 10 underlying holdings for ADV and spread width. If the basket is illiquid, expect the ETF spread to reflect that cost.
-
Confirm active creation and redemption. Look for recent changes in shares outstanding and check that multiple APs are listed in the prospectus.
-
Measure the average intraday premium or discount to NAV over the past 30 days. Deviations consistently above 0.25 to 0.50% are a red flag.
-
Evaluate market conditions and time of day. Avoid trading during the open, the close, or during high-volatility news events when spreads blow out.
When you spot multiple warning signs, the best decision is often to delay the trade or choose a more liquid alternative. If you must trade, use limit orders, slice the order, and avoid market orders. A few extra minutes of patience or a slightly different fund choice can save you 20 to 100 basis points in execution cost, which over time adds up to a real edge.
Final Words
Start by measuring the spread, midpoint, spread% and average daily volume. Then check underlying holdings, creation/redemption activity, and market depth.
Use Level I/II quotes, iNAV and time-of-day rules, and prefer limit or midpoint orders to cut costs. Calculate effective spread and compare to benchmarks before you trade.
This step-by-step guide to assess etf liquidity and bid-ask spread is a practical checklist you can run through before any trade. Do the small checks now and you’ll avoid big surprises and trade with more confidence.
FAQ
Q: What is the 3 5 10 rule for ETFs?
A: The 3 5 10 rule for ETFs is a simple trade-size guideline: keep orders to about 3% of ADV for tight spreads, 5% acceptable for moderate ETFs, and avoid exceeding 10% of ADV.
Q: How to assess ETF liquidity?
A: To assess ETF liquidity, check the bid‑ask spread and spread% (use the spread formula), average daily volume, displayed size or Level II depth, underlying holdings liquidity, and creation/redemption activity.
Q: What is the 7% rule in ETF?
A: The 7% rule in ETF is not a standard industry term; it has no single meaning. Tell me the context (tax, rebalancing, fees) and I’ll explain a relevant guideline.
Q: What is the 70/30 rule ETF?
A: The 70/30 rule ETF is an asset‑mix guideline: hold about 70% stocks and 30% bonds via ETFs to balance growth and income, then adjust for your timeline and risk comfort.

