

Picking ETFs by ticker feels like guessing, and that costs you money over time.
An ETF screener turns guesswork into a short list you can compare.
In this post you’ll get step-by-step instructions for using screeners to filter on costs, performance and risk tolerance, plus a simple order for which filters to apply first.
I’ll show practical thresholds, column sets to use, and a three-layer example so you can find funds that match your goals without overcomplicating things.
Practical ETF Screener Steps for Identifying Suitable Funds
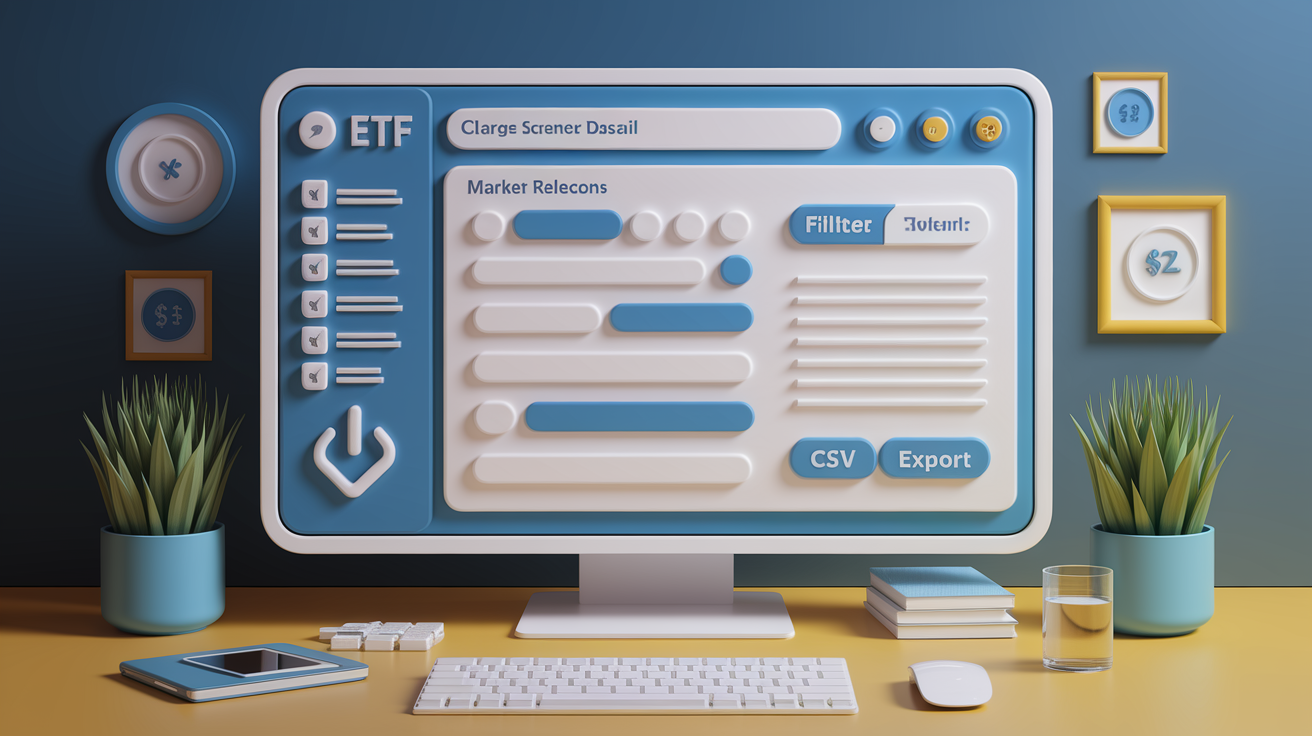
Most screener tools work the same way. You’ll find them through broker platforms or dedicated research sites. Open the screener interface, usually by clicking something like Products → Screeners → ETFs. The default view loads the US market sorted by assets under management, so you’ll see the biggest funds first. If you need a different region, click the market label and choose “More markets…” from the dropdown. Enable multi-select if you want to screen two or more regions at once. Helpful when you’re comparing US large-cap funds against international alternatives.
Check the “Primary listing” toggle next. Turn it on to show only ETFs listed on their main exchange, which filters out duplicate listings and keeps things cleaner. Turn it off if you specifically need off-primary listings, though most beginners should leave it on.
- Open the screener and confirm the default market (usually US) or pick a new one from the market dropdown.
- Enable multi-select if you want to compare funds across multiple regions.
- Toggle “Primary listing” to on unless you need duplicate or off-exchange listings.
- Find the “+” button in the filter toolbar, or press Shift + F to add a new filter.
- Scroll through the filter categories (Security info, Market data, Technicals, Analysis, Dividends) until you find what you need.
- Click the filter, set your thresholds or ranges, and click apply. Repeat for each additional filter.
- Sort the results table by any column header, then export the filtered list as a CSV file for offline review.
Once your filters are active, the screener updates the results table in real time. Click any column header to sort ascending or descending. Makes it easy to find the cheapest funds or the most liquid options. Use the “Hide filters” button to collapse the filter panel and see more funds at once. When you’re satisfied with the filtered list, click the export or CSV button to download the results for side-by-side comparison in a spreadsheet.
Core ETF Screener Filters for Narrowing Your Fund Choices

Investors usually start with cost and size thresholds because they directly affect long-term returns and trade execution. A low expense ratio means more of your money stays invested instead of going to fund fees. A higher assets-under-management threshold (often $100 million or more) signals that the fund has attracted enough investor interest to stay open and liquid. Screening for low tracking error or tight NAV performance helps you find funds that closely follow their benchmark, avoiding ETFs that drift away from the index they’re supposed to replicate. These foundational filters weed out underperforming or unstable products before you dive into strategy or sector choices.
Liquidity matters just as much as cost. Average daily volume tells you how many shares trade hands each day. Higher volume usually means tighter bid-ask spreads (the gap between buy and sell prices), which lowers your trading cost and slippage. Bid-ask spread widens when a fund is thinly traded, meaning you pay a hidden premium every time you buy or sell. Volatility filters help you match the fund’s price swings to your risk tolerance. A retiree looking for stable income will screen for low volatility, while a growth investor might accept higher swings for higher potential returns.
- Expense ratio: total annual fees. Lower is better, especially for long holds.
- Liquidity and volume: average daily trading volume and bid-ask spread. Higher volume means easier, cheaper trades.
- AUM threshold: total fund size. Larger funds are less likely to close and typically offer better liquidity.
- Dividend yield: annual distribution as a percentage of price. Important if you need income.
- Tracking difference and NAV performance: how closely the fund matches its index. Smaller gaps mean the ETF is doing its job.
Start by filtering on expense ratio and liquidity first. Set a maximum expense ratio based on your category (for example, 0.20 percent for broad index funds, 0.50 percent for sector or international funds) and a minimum average volume (for example, 100,000 shares per day). Then layer in AUM and tracking error thresholds to catch funds that are both cheap and reliable. Once you have a manageable list, you can add performance, yield, or strategic filters to fine-tune your choices.
Using ETF Screener Column Sets to Compare Funds
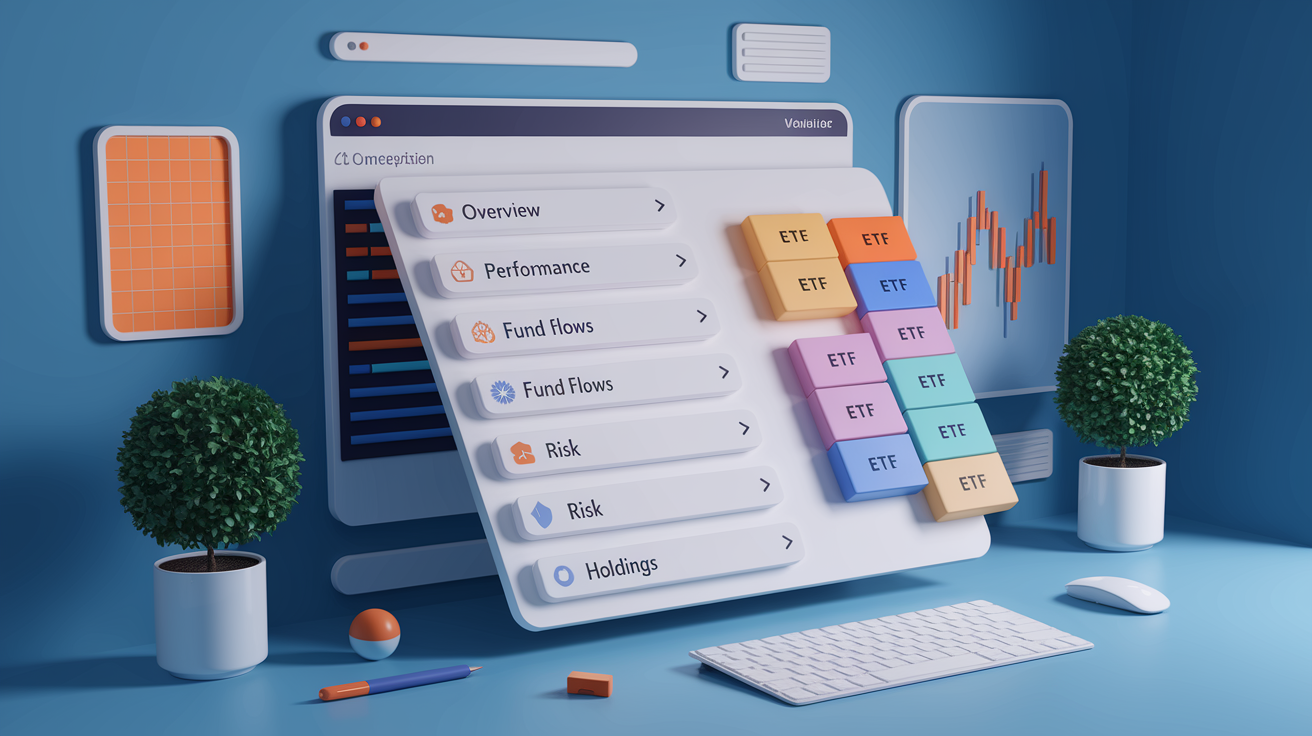
Column sets group related metrics into preset views, saving you time when you need to compare dozens of funds at once. Instead of manually adding or removing columns, you load a column set like “Overview,” “Performance,” or “Risk” and instantly see price, AUM, expense ratio, historical returns, beta, or volatility side by side. Each column set highlights a different aspect of the fund. Overview shows basic stats (ticker, price, AUM, asset class), Performance displays returns over various periods, Fund Flows tracks net money coming in or out, and Risk surfaces beta and volatility metrics. You can switch between sets with one click. Makes it simple to answer different questions without rebuilding your table each time.
Switch to the Performance column set when you want to compare trailing returns (1 month, 3 months, year to date, 1 year, 3 years). Use Fund Flows when you need to see whether investors are adding or pulling money, a sign of confidence or concern. Load the Risk column set to check beta (sensitivity to the market) and standard deviation (how much the fund bounces around). The Holdings column set reveals region, management style, index tracked, and leverage. Useful when you’re deciding between a plain-vanilla S&P 500 fund and a leveraged or inverse alternative. Toggle between sets as you refine your shortlist, and export the final view as a CSV when you’re ready for offline analysis.
| Column Set | What It Shows | Why It Matters |
|---|---|---|
| Overview | Price, AUM, asset class, issuer, exchange | Quick snapshot of fund basics. Confirms you’re looking at the right type of ETF |
| Performance | Trailing returns across multiple timeframes | Shows how the fund has performed historically. Helps compare consistency and strength |
| Fund Flows | Net money attracted or withdrawn over time | Reveals investor sentiment and confidence. Persistent outflows may signal trouble |
| Risk | Beta and volatility metrics | Measures price swings and market sensitivity. Helps match the fund to your risk tolerance |
Advanced ETF Screening Techniques for Precision Filtering

Weighting methodology filters let you separate market cap weighted ETFs from equal weight, fundamental weighted, or factor tilted strategies. Market cap weighting gives the biggest companies the largest slice of the fund, which can concentrate risk in a handful of mega cap stocks. Equal weight strategies assign the same percentage to every holding, spreading exposure more evenly but requiring more frequent rebalancing. Smart beta and factor filters screen for funds that overweight value, momentum, low volatility, quality, or size factors. Useful when you want to tilt your portfolio toward a specific investment thesis. Platforms like ETF.com include dedicated weighting method filters, while others require you to read the fund’s strategy description or index methodology to confirm the approach.
Technical indicator filters add another layer of precision for tactical or momentum driven strategies. You can screen for ETFs where the Relative Strength Index sits above 50 (indicating positive momentum) or below 30 (signaling oversold conditions). Exponential and simple moving averages (EMA and SMA) help you find funds trading above or below key trend lines, like the 50 day or 200 day moving average. Stochastic RSI, Momentum, and Keltner Channels let you filter on short-term overbought or oversold signals, though these are most relevant if you plan to trade the ETF rather than hold it long term. Be careful not to over rely on technical signals alone. Combine them with fundamental filters like expense ratio, AUM, and tracking error to avoid chasing a hot fund that’s expensive or thinly traded.
Combining fundamental cost and liquidity filters with advanced strategic and technical screens gives you a balanced shortlist. For example, start with a maximum 0.30 percent expense ratio and minimum $500 million AUM, then add a weighting method filter for equal weight or low volatility strategies, and finish with a technical filter requiring the fund to trade above its 200 day moving average. This three layer approach narrows thousands of ETFs to a handful of candidates that are cheap, stable, and showing positive momentum. Save the combined screen so you can re-run it monthly or quarterly without rebuilding every filter from scratch.
Screening for Regional, Sector, Bond, and ESG ETFs

Different ETF categories require different filter priorities. Regional filters let you isolate US only funds, international developed markets, emerging markets, or specific countries like China or Japan. Sector and industry filters narrow the list to technology, healthcare, energy, financials, or consumer staples. Helpful when you want targeted exposure or need to fill a gap in your portfolio. Bond ETF screens add credit quality filters (investment grade, high yield, government) and duration filters (short term, intermediate, long term), essential for managing interest rate risk and default risk. ESG and sustainability filters surface funds that exclude certain industries (like fossil fuels or tobacco) or target companies with high environmental, social, and governance scores. Carbon footprint screening is available on some platforms, useful if you want to align your portfolio with climate goals.
- Regional filters: isolate funds by geography (US, international developed, emerging markets, single countries).
- Sector and industry filters: focus on technology, healthcare, energy, or other specific sectors.
- Credit quality and duration filters: separate investment grade from high yield bonds. Match duration to your interest rate outlook.
- ESG and sustainability filters: find funds excluding certain industries or targeting high ESG scores.
- Dividend policy filters: screen by yield, frequency (monthly, quarterly), and distribution treatment (qualified vs. ordinary income).
- Index and strategy filters: identify which benchmark the ETF tracks and whether it uses leverage, inverse, or alternative weighting.
Use specialized screens when your goal goes beyond broad market exposure. If you need monthly income, filter for high dividend yield and monthly distribution frequency. If you’re building a socially responsible portfolio, combine ESG filters with low expense ratios and high AUM to avoid niche funds that might close. If you’re hedging a concentrated stock position, screen for low correlation sectors or regions. Apply these filters after your core cost and liquidity screens to keep results practical and tradable.
Evaluating Shortlisted ETFs After Running the Screener

Screener results give you a starting point, not a final decision. Once you have a shortlist of five to ten funds, compare the expense ratio of each against the category average to confirm you’re getting a fair deal. Many broad US equity ETFs charge under 0.10 percent, while niche international or sector funds might justify 0.30 to 0.50 percent. Next, check tracking consistency by reviewing NAV performance and comparing it to the fund’s stated benchmark. A fund that consistently lags its index by more than its expense ratio may have cash drag, poor rebalancing, or securities lending issues. Look at the fund’s holdings page or prospectus to see the top ten positions and confirm they align with your expectations. Sometimes two funds tracking the same index hold slightly different stocks due to sampling or optimization techniques.
Evaluate holdings overlap if you already own other ETFs or individual stocks. Paste each fund’s top holdings into a spreadsheet and highlight duplicates. If two of your shortlisted ETFs both hold 20 percent in the same five mega cap tech stocks, you’re not as diversified as you think. Check volatility (standard deviation) and beta to understand how much the fund swings relative to the broader market. A beta above 1.0 means the fund amplifies market moves, while a beta below 1.0 dampens them. Review dividend yield, distribution frequency, and tax treatment (qualified vs. ordinary income) if income or tax efficiency matters to your strategy. Fund flows matter too. Persistent outflows over several quarters can signal investor distrust or poor performance, and might eventually force the issuer to close the fund.
- Compare the expense ratio to category peers and confirm it’s competitive for the exposure you’re getting.
- Analyze tracking difference by checking how closely NAV performance matches the benchmark, accounting for fees.
- Review the top holdings and confirm they align with the fund’s stated strategy and your portfolio needs.
- Check for holdings overlap with your existing positions to avoid unintended concentration.
- Examine beta and volatility to match the fund’s risk profile to your tolerance and timeline.
- Confirm dividend yield, distribution schedule, and tax treatment if income or tax efficiency is a priority.
Manual review catches details screeners miss, like changes in fund management, recent strategy shifts, or pending mergers. Read the fund’s summary prospectus (usually two to three pages) to understand the investment objective, principal risks, and fee structure. Cross-check AUM and average daily volume one more time before you buy. Funds below $50 million in assets or trading fewer than 10,000 shares per day carry closure risk and wider spreads. This final due diligence step turns a screener output into a confident, informed ETF choice.
Saving Screens, Exporting Results, and Building a Long-Term ETF Watchlist
Most screener platforms let you save your filter configurations so you can re-run the same screen weekly or monthly without rebuilding it from scratch. Click the blue “Save” button (or equivalent) after you’ve set your filters, give the screen a descriptive name like “Low Cost US Equity” or “High Yield Bonds Under 0.40%,” and access it later from the screener menu or vault. Saved screens are especially useful for tactical strategies or periodic portfolio reviews. Run the screen at the start of each quarter to see which new funds have crossed your thresholds or which existing holdings no longer pass your criteria. Export the results as a CSV file to sort, annotate, or compare funds offline in Excel or Google Sheets, where you can add your own notes, track changes over time, or build custom comparison tables.
Building a watchlist from your screened results keeps you organized and ready to act when opportunities appear. Most platforms let you create multiple watchlists. Name one “Core ETF Candidates” for broad market funds and another “Tactical/Sector ETFs” for specialized plays. Add tickers to the watchlist by clicking a checkbox or typing the symbol, then set price alerts or news notifications so you know when a fund hits your buy threshold or releases an important update. Re-evaluate your watchlist and saved screens every three to six months, updating filter thresholds as market conditions change or your goals shift.
- Save your filter configuration with a clear, descriptive name so you can re-run the screen quickly.
- Export the filtered results as a CSV file for offline analysis, annotation, and record keeping.
- Create one or more watchlists from your top candidates and organize them by strategy or asset class.
- Set alerts on watchlist tickers for price thresholds, volume spikes, or news events.
- Re-run saved screens quarterly or when your investment goals change, adjusting filters as needed.
Treat your screener as a living tool, not a one-time search. Markets evolve, new ETFs launch, and fund costs occasionally drop due to fee competition. By saving screens and maintaining an updated watchlist, you stay ready to refine your portfolio without starting your research from zero every time. Hide the filter panel after you’ve set your criteria to maximize the number of results visible on screen, making it easier to scan and compare dozens of funds at a glance.
Final Words
We walked through the steps to open and run the ETF screener: set region and primary listing, multi‑select markets, add filters, switch column sets, try advanced and sector filters, and export results.
You also got a short post‑screen checklist—expense ratios, tracking, holdings overlap, volatility, and yield—and simple steps to save screens, create a watchlist, and recheck periodically.
If you practice how to use an etf screener to find suitable funds a few times, it will feel routine. Start small, tweak your filters, and keep going — you’ve got this.
FAQ
Q: How do I choose the right ETF screener?
A: The right ETF screener is one that offers the filters you need (AUM, expense ratio, volume), easy region/multi‑select controls, save/export options, clear column sets, and quick sorting for practical comparison.
Q: What is the 7% rule in ETF?
A: The 7% rule in ETF is not a single standard. People sometimes mean a 7 percentage‑point rebalance trigger or a rough return target; meaning varies, so check the source and match it to your goals.
Q: What is the 3 5 10 rule for ETFs?
A: The 3‑5‑10 rule for ETFs is not universal. A common version: 3 core funds, 5 total holding types, and no more than 10% in a single non‑core position — adjust to your timeline and risk.
Q: How to search ETF in screener?
A: To search an ETF in a screener, open the ETF screener, confirm region, type the ticker or name, use + or Shift+F to add filters, toggle primary listing, then sort and export results.

