

Think all ETFs are the same?
They are not, and beginners often waste hours reading fund pages without a clear way to compare.
This post gives a 10-step beginner checklist you can run in about 10 minutes to spot high fees, weak liquidity, tracking gaps, and concentration risks before you buy.
No fund is perfect; this checklist helps you see tradeoffs and pick a fund that fits your goals and timeline.
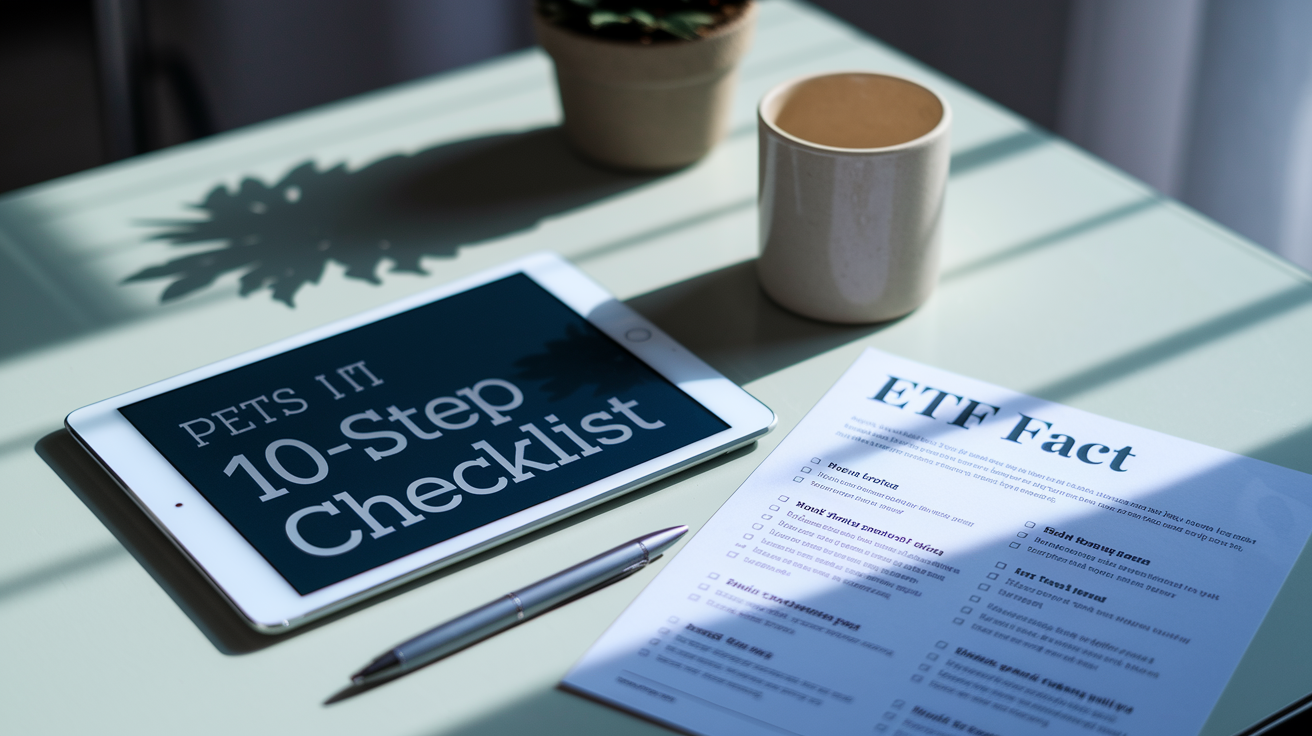
ETF Checklist: The Fastest Way to Compare Funds

Most beginners burn hours reading fund descriptions and still walk away confused. The trick? Run through one simple checklist every time. Once you know what to look for, it takes about 10 minutes.
Below is a 10 step beginner checklist that covers every critical metric without the jargon. Run any ETF through this before you buy.
-
Expense ratio under 0.20 percent for broad index funds – For a plain vanilla U.S. or global stock ETF, you shouldn’t pay more than 0.20 percent per year. If the fund charges more, skip it unless it offers something genuinely unique.
-
Assets under management (AUM) at least 100 million USD – Small funds can close suddenly or trade at bad prices. Aim for 100 million USD or higher. Funds over 1 billion USD are even safer.
-
Tight bid ask spread, ideally under 0.05 percent – This is the gap between the price someone will pay and the price someone will sell. Wider spreads eat into your returns every time you trade.
-
Tracking difference close to zero – Compare the ETF’s actual return to its index return over the past year. If the ETF lags by more than the expense ratio, that’s a red flag.
-
Clear index methodology – The fund fact sheet or prospectus should spell out exactly what index the ETF tracks and how stocks are weighted (for example, market cap weighting or equal weighting). If it’s vague, walk away.
-
Average daily trading volume above 100,000 shares – Higher volume usually means tighter spreads and easier entries or exits, especially if you invest larger amounts later.
-
At least 50 holdings for diversification – A handful of stocks isn’t diversification. Look for 50 or more underlying holdings so one company’s bad week doesn’t wreck your position.
-
Balanced sector and region exposure – Check the top 10 holdings and the sector breakdown. If one sector or one country makes up more than 40 percent of the fund, you’re taking concentrated risk.
-
Reputable issuer with a long track record – Stick with established providers. A fund that launched last month has no real world proof that it can track its index through market swings.
-
No unnecessary complexity – Avoid leveraged, inverse, or exotic strategy ETFs until you’ve got years of experience. If the fund description uses words you have to Google three times, it’s not beginner friendly.
Breaking Down Key ETF Costs
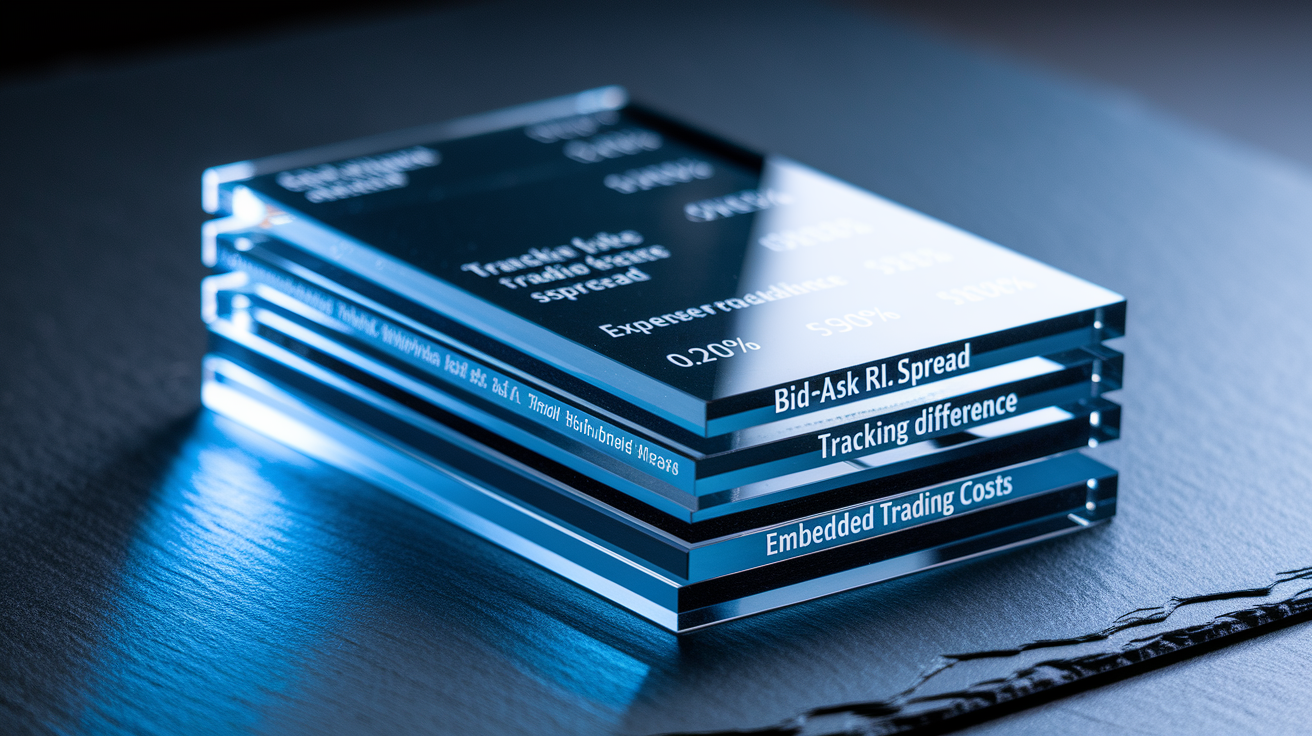
The expense ratio is the headline number. But it’s not the only cost you pay. Every ETF has at least four layers of cost that chip away at your return over time.
Expense ratio – This is the annual management fee, usually between 0.03 percent for the cheapest index funds and 0.75 percent or more for thematic or actively managed ETFs. It’s deducted from the fund’s assets every day, so you never see a separate bill.
Bid ask spread cost impact – When you buy, you pay the ask price. When you sell, you get the bid price. The difference is profit for the market maker and a cost for you. A 0.10 percent spread on a 5,000 PLN purchase costs you 5 PLN immediately.
Tracking difference cost implications – Even if an ETF has a low expense ratio, it can still underperform its index because of trading friction, cash drag, or sampling error. If the index returns 8 percent and the ETF returns 7.70 percent, that extra 0.10 percent difference is a hidden cost.
Embedded trading costs within the fund – The ETF manager buys and sells stocks when the index rebalances or when new money flows in. Those trades create commissions and market impact costs. They show up as tracking difference rather than in the stated expense ratio.
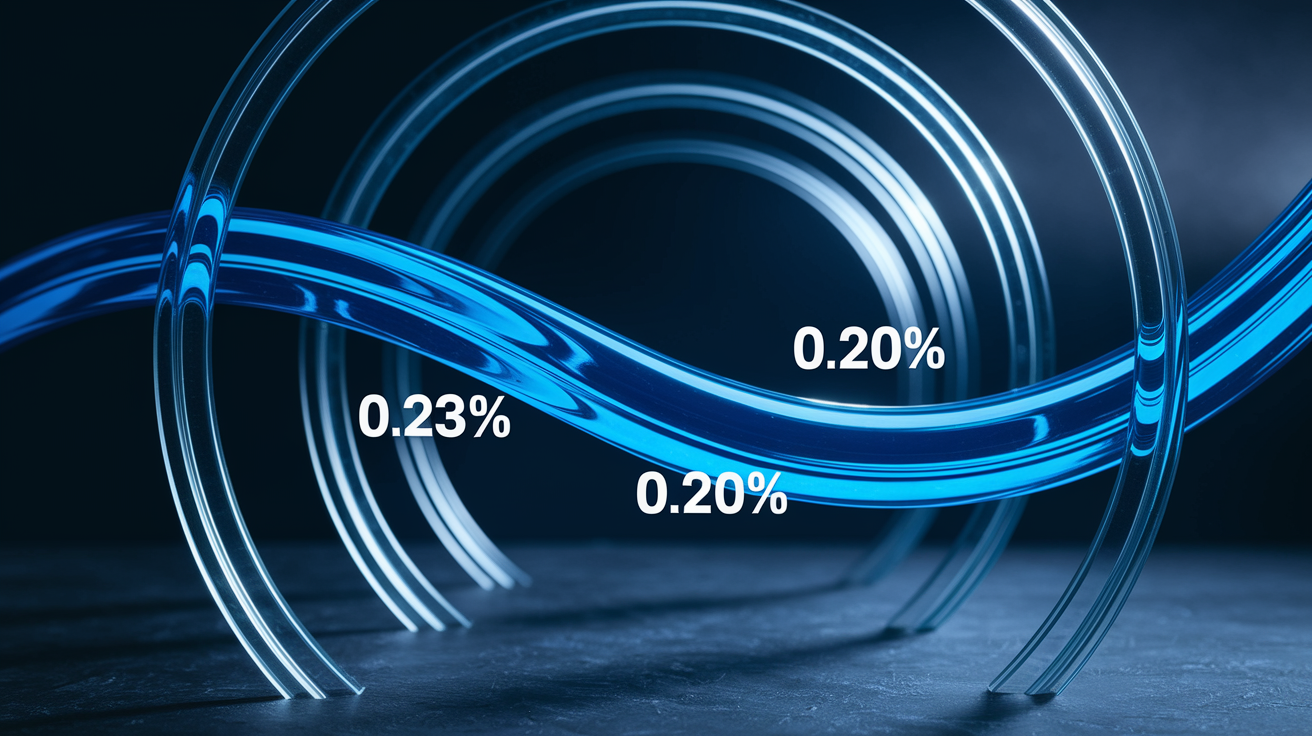
A 0.20 percent expense ratio sounds cheap. But if the bid ask spread is 0.15 percent and the tracking difference adds another 0.10 percent per year, your real cost is 0.45 percent. Compare the total package, not just the label.
Is a higher expense ratio ever justified? Yes, when the ETF delivers something you can’t get cheaper elsewhere. Like exposure to a small country index with only one available fund, or a bond ETF that saves you from buying individual bonds. If three similar funds exist and one charges double, skip the expensive one.
Liquidity, Trading Volume, and Bid‑Ask Spreads
Liquidity isn’t just about how many shares change hands each day. An ETF can trade only 10,000 shares a day and still be highly liquid if it holds assets that trade millions of shares daily, like large cap U.S. stocks.
The real liquidity comes from the underlying holdings. Market makers can create or redeem ETF shares whenever they want by assembling or disassembling baskets of the underlying stocks. If those stocks are easy to buy and sell, the ETF will have tight spreads no matter what its own volume looks like. A U.S. total market ETF with 50,000 shares traded per day is far more liquid than a frontier markets ETF trading 200,000 shares per day, because the U.S. stocks underneath are easier to trade.
Bid ask spreads tell you the real story. A spread of 0.03 percent means you lose 3 PLN per 10,000 PLN invested just to enter the position. A spread of 0.20 percent costs you 20 PLN per 10,000 PLN. And that happens again when you sell. For a buy and hold investor, a 0.20 percent spread is annoying but survivable. For someone who rebalances quarterly or trades multiple times per year, those costs stack up fast.
Check the spread during market hours (not at the open or close) and compare it to similar ETFs. If one fund’s spread is three times wider than its competitor with no clear reason, pick the competitor.
Understanding Tracking Error and Index Methodology
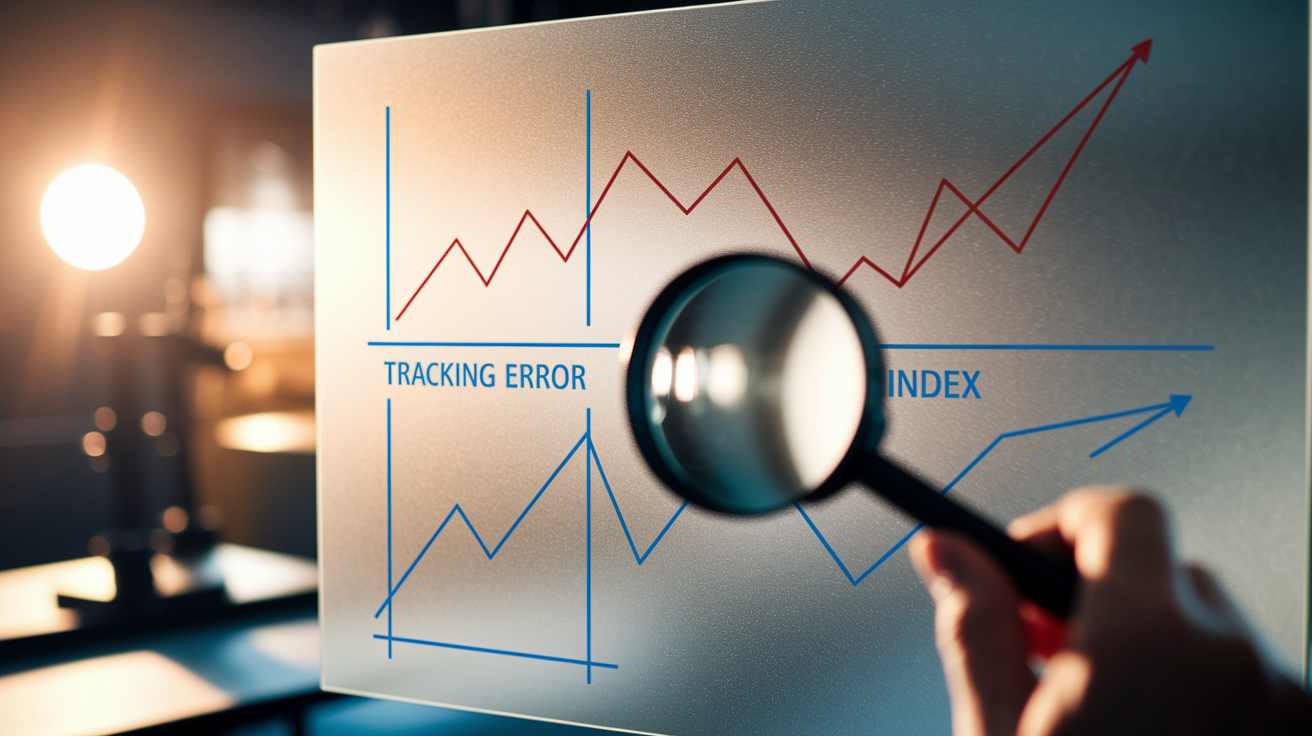
Tracking error and tracking difference sound similar, but they measure different things. Both matter when you’re deciding whether an ETF does its job.
| Term | Meaning | Why It Matters |
|---|---|---|
| Tracking error | The volatility of the difference between ETF returns and index returns, measured as a standard deviation | High tracking error means the ETF’s performance bounces around the index unpredictably, even if the average difference is small |
| Tracking difference | The actual gap between the ETF’s return and the index return over a set period, like one year | This is the real world cost you pay beyond the expense ratio; a negative tracking difference means you earned less than the index |
| Index weighting method | How the index decides what percentage of each stock to hold (market cap, equal weight, factor tilt, or custom rule) | Different weighting methods create different risk and return profiles; market cap puts more money in the biggest companies |
| Index selection rules | The criteria an index uses to add or remove stocks (for example, minimum size, liquidity filters, sector caps, country classifications) | Selection rules determine whether you own 500 stocks or 3,000 stocks, and whether small caps or only large caps make the cut |
Imagine two ETFs that both say they track “global stocks.” ETF A follows an index that holds 1,600 large and mid cap stocks from developed markets, weighted by market cap. ETF B tracks an index with 3,700 stocks from developed and emerging markets, also market cap weighted. Both are “global,” but ETF B gives you emerging market exposure and thousands more small companies.
The index methodology explains why their returns will differ even though the labels sound identical. Always read the index fact sheet or methodology document (usually one or two pages) so you know exactly what you own. If the ETF provider doesn’t publish it or makes it hard to find, that’s a warning sign.
ETF Holdings, Diversification, and Risk Exposure

An ETF can hold 500 companies and still be risky if the top 10 make up half the fund. Diversification is about how the money is spread, not just the number of names on the list.
Check these five data points before you decide the ETF is truly diversified:
Top 10 concentration – Add up the weights of the 10 largest holdings. If they total more than 30 percent, the fund is heavily concentrated. A 50 percent top 10 weight means half your money rides on 10 companies.
Total number of holdings – More is usually better, but only if the smaller holdings get meaningful weight. A fund with 2,000 stocks where the top 50 make up 80 percent is less diversified than a 200 stock fund with even weights.
Sector exposure – Look at the sector breakdown. If technology is 35 percent of the fund and the next biggest sector is 12 percent, you’re making a big tech bet whether you meant to or not.
Geographic exposure – A “global” fund might be 60 percent U.S. stocks. An “emerging markets” fund might be 40 percent China. Know where your money actually goes.
Single stock risk – No single company should be more than 5 percent of the ETF unless you’re buying a concentrated strategy on purpose. If one stock is 8 percent and it drops 50 percent, your ETF loses 4 percent instantly.
Run through these checks by opening the ETF’s holdings page on the issuer’s website. Most providers update holdings monthly, and the top 10 list plus sector and country breakdowns are usually on the overview tab. If that data is missing or outdated by more than two months, find a different fund.
Red Flags Beginners Should Watch For

Some ETFs look fine at first glance. Then you dig into the details and problems show up. A few warning signs appear again and again with funds that end up costing investors money or closing unexpectedly. If you spot two or more of these red flags on the same ETF, move on to the next option.
Six red flags that should stop you from buying:
AUM under 20 million USD – Tiny funds struggle to cover their operating costs and often shut down within two years, forcing you to sell and triggering a taxable event at an inconvenient time.
Less than one year since launch – New ETFs have no real track record. You can’t verify tracking error, trading costs, or how the fund behaves during a market drop.
Leveraged or inverse structure – These funds use derivatives to multiply returns (2x, 3x) or bet against an index. They reset daily and can lose money even if you’re right about direction over a longer period. Not for beginners.
Bid ask spread above 0.20 percent consistently – Check the spread at 11 a.m. and 2 p.m. on a normal trading day. If it’s still over 0.20 percent, your trading costs will erase years of compounding.
Vague or complex index methodology – If the fund description uses phrases like “proprietary algorithm” or “dynamic weighting” without explaining exactly how it works, you can’t predict what you own or how it will perform.
Tracking difference worse than expense ratio by more than 0.10 percent – An ETF with a 0.15 percent expense ratio should lag its index by about 0.15 percent per year. If it lags by 0.30 percent or more, something is broken. Whether it’s poor trading, cash drag, or hidden costs.
How to Apply the Checklist to a Real ETF Example
Let’s walk through the 10 step checklist using a hypothetical broad market equity ETF. This example shows you how to score each criterion in under 10 minutes.
Step one, expense ratio – The fund charges 0.08 percent per year. That’s well under the 0.20 percent threshold for a plain index fund. Pass.
Step two, AUM – The ETF has 8 billion USD in assets. Far above the 100 million minimum, so closure risk is nearly zero. Pass.
Step three, bid ask spread – At 11 a.m. on a Tuesday, the bid is 142.35 and the ask is 142.40. That’s a 5 cent spread on a 142 dollar price, or 0.035 percent. Well under 0.05 percent. Pass.
Step four, tracking difference – Over the past 12 months, the index returned 9.20 percent and the ETF returned 9.11 percent. The difference is 0.09 percent, matching the expense ratio almost exactly. Pass.
Step five, index methodology – The fact sheet states the fund tracks the “Global Large and Mid Cap Index,” which holds 2,400 stocks weighted by market capitalization, rebalanced quarterly. The methodology document is two pages and easy to read. Pass.
Now score liquidity, holdings, and risk. The ETF trades 2 million shares per day on average (pass). It holds 2,400 stocks with the top 10 making up 18 percent (pass). Technology is 22 percent of the fund, financials are 16 percent, and no other sector tops 12 percent (balanced, pass). The U.S. is 55 percent, Europe is 18 percent, and Asia is 15 percent (reasonable global split, pass). The largest single stock is 3.1 percent (pass). The issuer is a top five global provider with a 15 year track record (pass).
This ETF scores 10 out of 10 on the checklist. It costs little, trades easily, tracks tightly, and spreads risk across thousands of companies. That’s what a beginner should buy.
Tools and Resources for Quick ETF Evaluation
You don’t need expensive software to evaluate ETFs. A handful of free tools and a 10 minute routine will get you everything the checklist requires.
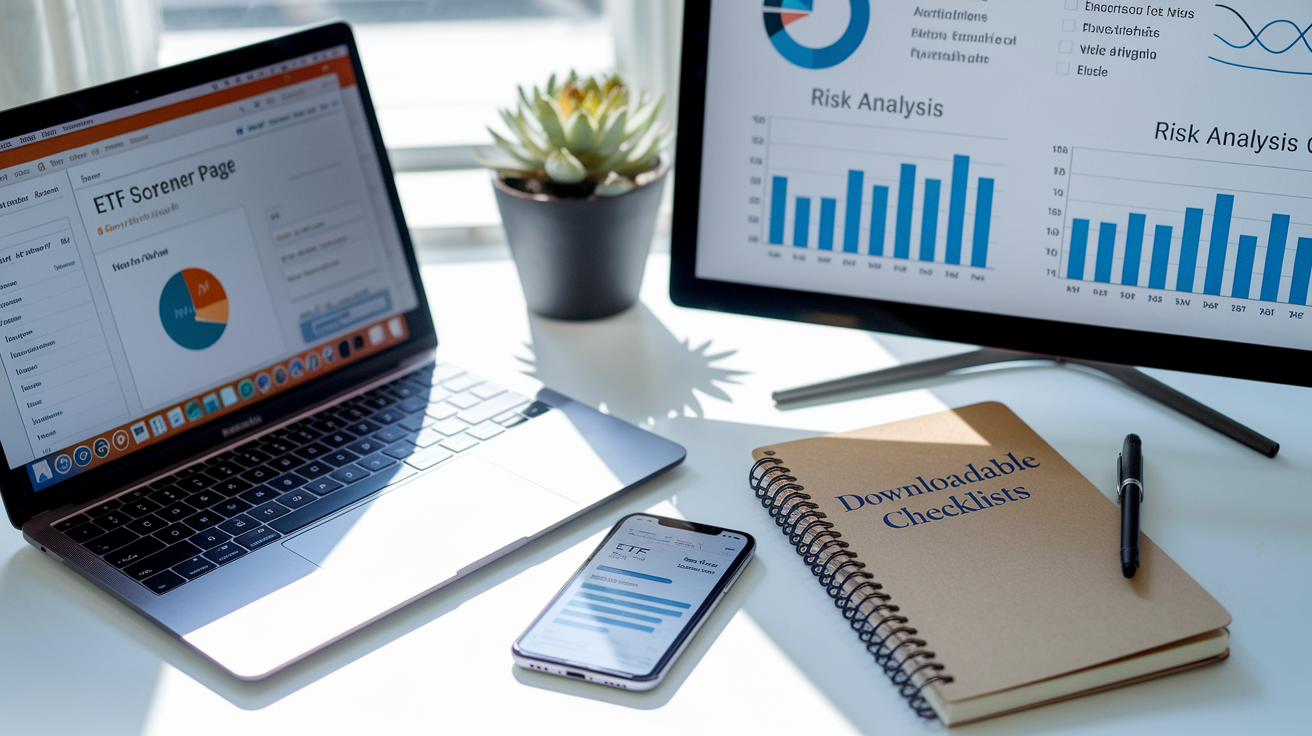
ETF screeners let you filter by expense ratio, AUM, category, and issuer. Most brokerage platforms include a built in screener, and several fund research websites offer free versions that show expense ratios, tracking error, and top holdings side by side. Set your filters to show only funds with more than 100 million USD in assets and expense ratios under 0.30 percent. Then sort by trading volume or AUM to narrow the list.
Risk analysis tools are available on many fund provider websites. These tools break down sector exposure, geographic concentration, and top 10 holdings weight in a single summary page. Some also show historical tracking error and tracking difference going back three or five years. Use these to compare two similar ETFs and pick the one with tighter tracking and lower concentration.
Portfolio simulators let you model a mix of ETFs and see projected returns, risk, and correlation. They’re useful when deciding between a single global fund and a two fund portfolio (developed plus emerging markets). Free versions usually limit you to five funds and basic statistics, which is enough for beginners.
Downloadable checklists – Print the 10 step list from the first section of this article and keep it next to your computer. Fill it out for each ETF you research and file the pages in a folder. Six months later, when you want to compare your shortlist again, you’ll have all the data in one place instead of hunting through browser tabs.
Final Words
Use the checklist to compare ETFs on cost, liquidity, tracking, holdings, issuer, and red flags. This article gave a 10-step checklist, explained costs and liquidity, unpacked tracking error and index rules, showed what to watch for, walked through a sample ETF, and listed handy tools.
Run the steps with a real ETF, check numbers like expense ratio and bid-ask spread, and avoid tiny AUM or wide spreads. Practice until it’s quick.
Keep this etf evaluation checklist for beginners handy. It makes choices calmer and clearer.
FAQ
Q: What are the most important things to check first when evaluating an ETF?
A: The most important things to check first are costs, liquidity, and holdings: look for a low expense ratio (a simple guideline: under 0.20% for broad index funds), tight spreads, and clear diversification.
Q: What is a simple 10-step ETF checklist for beginners?
A: A simple 10-step ETF checklist is: expense ratio, AUM over $100M, bid-ask spread, tracking difference/error, index methodology clarity, liquidity, holdings diversification, sector and region exposure, issuer stability, and avoiding complex structures.
Q: How do ETF expense ratios affect long-term returns and how can beginners judge if a fee is fair?
A: ETF expense ratios reduce long-term returns; judge fairness by fund type: broad market funds often sit below 0.10%, thematic or active funds may exceed 0.70%, and higher fees should buy clear, different exposure.
Q: What’s the difference between bid-ask spread and expense ratio, and how do spreads add cost?
A: The bid-ask spread is the immediate trading cost, while the expense ratio is an annual internal fee. Wider spreads (for example 0.20% versus 0.03%) increase the visible cost every time you trade.
Q: How do I check ETF liquidity and why do underlying holdings matter more than daily volume?
A: You check ETF liquidity by looking at tight spreads, average daily volume, and the liquidity of the underlying assets—underlying holdings often determine true liquidity, especially for thinly traded markets.
Q: What is tracking error and tracking difference, and why should beginners care?
A: Tracking error measures how consistently returns match the benchmark, while tracking difference is the average over- or under-performance; beginners should care because lower values mean the ETF more closely follows its index.
Q: How do I analyze ETF holdings for hidden concentration or country/sector risk?
A: Analyze ETF holdings by checking top-10 concentration, total number of holdings, sector and geographic weightings, and any single-stock exposure that could create outsized risk in the fund.
Q: What are the main red flags to watch for in an ETF?
A: Main red flags are very low AUM (for example under $20M), newly launched funds without history, leveraged or inverse structures, unusually wide spreads, unclear index methodology, and opaque holdings.
Q: How do I apply the checklist to a specific ETF in five steps?
A: Apply the checklist in five steps: check expense ratio and AUM, review spreads and liquidity, compare tracking data, inspect holdings for concentration and exposures, and note issuer strength and complex features.
Q: What tools can beginners use to evaluate ETFs quickly?
A: Beginners can use ETF screeners, risk-analysis tools, portfolio simulators, and downloadable checklists to compare expense ratios, holdings, performance, spreads, and basic risk metrics fast.
