
Ever wonder why your portfolio jumps and drops even when the headlines look the same?
Market volatility (how much and how fast prices swing) often comes from surprising economic data, central bank moves, company earnings, geopolitical shocks, or the way traders and algorithms react to news.
This post explains the main causes of those price swings and why they matter for both risk and opportunity.
You’ll get simple, practical steps you can use today: spread your bets, set a regular investing plan, and keep a long-term view that matches your goals.
Core Explanation of Market Volatility
Market volatility measures how much and how fast prices move. When prices swing sharply up or down over short periods, volatility is high. When markets drift slowly or stay flat, volatility is low. It’s usually reported as a percentage, often based on the standard deviation of daily returns.
It matters because volatility affects both risk and opportunity. High volatility means bigger potential gains but also bigger potential losses. It influences option prices, margin requirements, and how much sleep you lose checking your portfolio. Volatility also signals uncertainty. When investors disagree about what comes next (whether that’s inflation data, earnings, or geopolitical risk), prices bounce around more as they react to every headline.
Right now, volatility is elevated compared to the calm years of the mid‑2010s. Interest rates have climbed, central banks are still navigating inflation targets, and geopolitical tensions flare unpredictably. Earnings seasons bring sharp reactions when companies miss or beat forecasts. Technology stocks, which led the market for years, have become more sensitive to rate changes and regulatory news. All of that combines to create an environment where a single tweet, tariff announcement, or jobs report can move the S&P 500 by 1 or 2 percent in a day. If you’ve felt whipsawed lately, that’s volatility at work.
How Market Volatility Is Measured

Investors and traders use several tools to put a number on volatility. Each one answers a slightly different question about how prices are moving or how much movement the market expects.
Standard deviation calculates how much returns scatter around the average over a chosen window, like the past month or year. It’s expressed in percentage terms. If a stock has a 20 percent annualized standard deviation, daily returns typically fall within ±1.3 percent (roughly 20 percent divided by the square root of 252 trading days).
Historical volatility is the same concept, focused on realized past movements. You pick a lookback period (30 days or 90 days), compute the standard deviation of daily returns, and annualize it by multiplying by the square root of 252. This tells you how jumpy the security actually was.
Implied volatility comes from option prices. When traders pay more for options, they’re expecting bigger price swings. Implied volatility is forward‑looking, a market consensus bet on how much movement is coming, even if that bet ends up wrong.
Realized volatility is what actually happened. You can compare it to implied volatility to see whether the market over‑ or under‑estimated the chop. If implied was 25 percent but realized was only 15 percent, option sellers made money. Option buyers overpaid for protection that wasn’t needed.
The VIX, often called the “fear index,” measures the 30‑day implied volatility of the S&P 500 using near‑term index option prices. It’s calculated from a weighted average of those prices. When the VIX sits below 12, markets are calm. A VIX between 12 and 20 is moderate, typical during steady growth. Above 20 signals elevated anxiety. Above 30 means investors are pricing in real fear. Above 40 is extreme, the kind of reading you see during credit crises or pandemics. On March 16, 2020, the VIX spiked to roughly 82.69 as COVID lockdowns accelerated, the highest close on record.
| Metric | What It Measures | Typical Use Case |
|---|---|---|
| Standard deviation | Dispersion of returns around the mean | Quantifying historical price variability |
| Implied volatility | Market expectation of future swings (from options) | Pricing options, gauging sentiment |
| VIX | 30‑day expected S&P 500 volatility | Market‑wide fear indicator |
| Beta | Volatility relative to a benchmark (e.g., S&P 500) | Comparing individual stock or sector risk |
Primary Causes of Market Volatility

Volatility is rarely the result of a single trigger. It builds when uncertainty rises and when buyers and sellers can’t agree on a fair price, so they test each other with bigger swings.
Economic catalysts dominate the calendar. Inflation reports, especially the Consumer Price Index and Producer Price Index, can send stocks and bonds moving in opposite directions if the numbers surprise. Central‑bank decisions on interest rates matter even more. A quarter‑point hike might be priced in, but hawkish language in the press conference can rattle equity markets. GDP readings, unemployment figures, and manufacturing indices all feed into the narrative about whether the economy is accelerating, decelerating, or heading into recession. When the data conflicts (like strong jobs but weak retail sales), volatility climbs as traders reposition.
Non‑economic shocks add fuel. Geopolitical conflict, wars, sanctions, or sudden diplomatic breakdowns can freeze capital flows and spike oil or commodity prices. Natural disasters disrupt supply chains and earnings forecasts. Corporate earnings seasons compress all that company‑specific uncertainty into a few weeks. A single mega‑cap tech firm missing revenue by 2 percent can drag the entire sector down 5 percent in a day.
Rumors about tariffs, regulatory crackdowns, or executive departures move individual stocks violently. High‑frequency algorithms and leveraged exchange‑traded products can amplify these moves, because they execute automatically and can overwhelm liquidity during thin trading windows.
Current Market Conditions and Volatility Trends
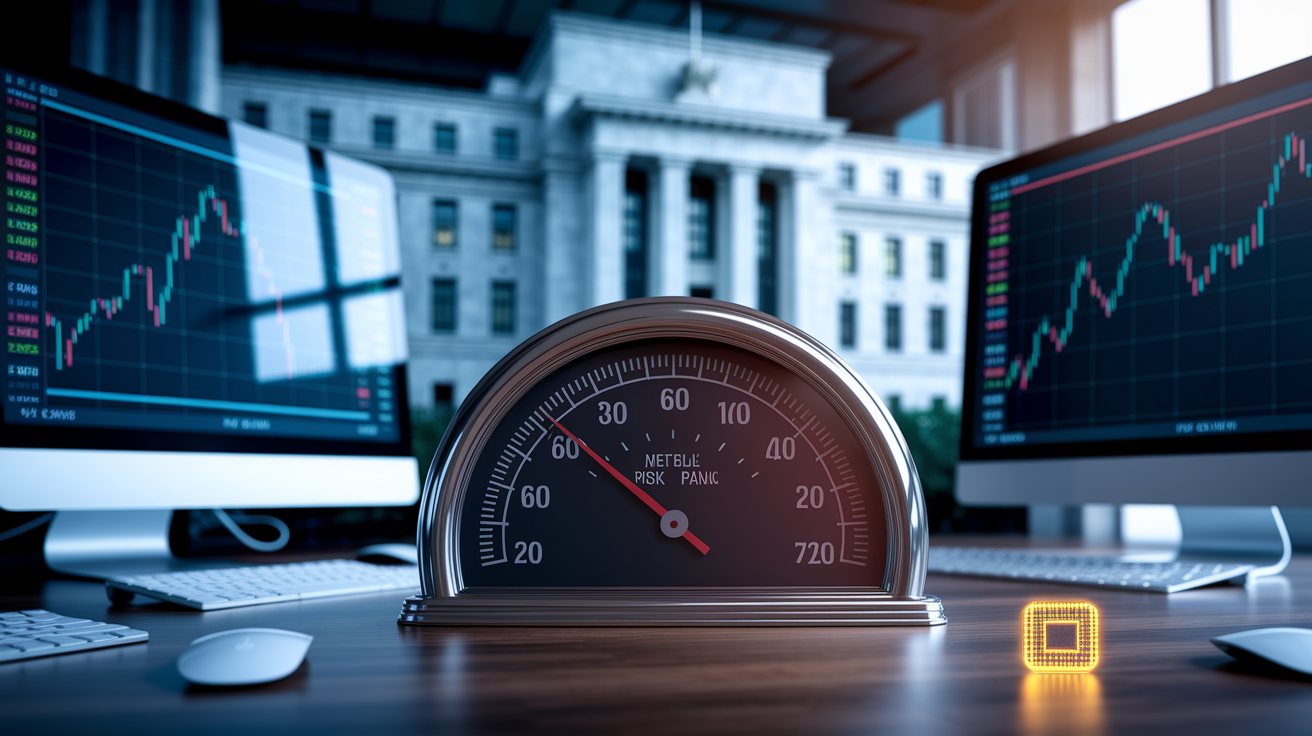
Over the past year, volatility has been higher than the quiet 2017–2019 period but below the panic spikes of 2020. The VIX has mostly hovered in the high teens to mid twenties, occasionally jumping above 30 when a policy surprise or geopolitical headline hits.
Short‑term catalysts keep appearing. Earnings season every quarter brings concentrated risk, especially for technology and consumer discretionary names. Monthly inflation prints still move the market, even though inflation has cooled from the 2022 peak. Any hint that the Federal Reserve might pause, cut, or resume hikes sends traders scrambling to reprice equities and bonds.
Broader trends tie back to interest rates and global uncertainty. Rates are no longer near zero, so the discount rate on future cash flows is higher and more sensitive to changes. That makes growth stocks, which rely on distant earnings, more volatile. Geopolitical risks, from trade disputes to regional conflicts, haven’t disappeared. They simmer and occasionally boil over.
Liquidity in some corners of the market (particularly small‑cap stocks and certain fixed‑income sectors) remains thinner than before the pandemic, which means smaller order flow can cause bigger price jumps. Technology continues to play a dual role, with AI enthusiasm driving sharp rallies and regulatory or competitive worries triggering sudden sell‑offs.
Strategies Investors Use to Navigate Volatility

When markets get choppy, having a plan keeps you from making decisions you’ll regret in calmer times.
Diversification spreads risk across asset classes, sectors, and geographies. A mix of U.S. equities, international stocks, bonds, and maybe a slice of commodities or real estate means no single shock takes down your whole portfolio. Example: if tech stocks drop 10 percent but utilities stay flat and bonds rally, the blend softens the overall hit.
Dollar‑cost averaging means investing a fixed amount on a regular schedule (monthly or every paycheck), regardless of price. You buy more shares when prices are low and fewer when they’re high. Over time, this averages out your entry points and removes the need to time the market. Example: setting a $500 automatic transfer into an index fund on the first of every month.
Hedging uses options or other derivatives to limit downside. Buying put options on an index or individual holding gives you the right to sell at a set price, capping your loss. Protective collars (selling a call and buying a put) can fund the hedge but cap upside. These strategies cost money. Option premiums aren’t free, and they can drag on returns if volatility never materializes.
Rebalancing resets your portfolio back to target allocations. If stocks rally and now represent 70 percent of your mix instead of 60 percent, you sell some equity and buy bonds. This forces you to trim winners and add to laggards, a disciplined form of sell high, buy low. Do it annually or when allocations drift by more than 5 percentage points.
Long‑term focus means ignoring daily noise and sticking to your plan. If your goal is 20 years away, a 15 percent drop today is just a data point in a much longer story. History shows the S&P 500 has recovered from every prior drawdown, though past performance doesn’t guarantee future results.
Each approach works best in different settings. Diversification and dollar‑cost averaging fit almost every investor, especially beginners or people with steady income. Hedging makes sense when you have concentrated exposure or a near‑term goal you can’t afford to miss. Rebalancing enforces discipline and works well for tax‑deferred accounts where sales don’t trigger capital gains. Long‑term focus is the psychological anchor. Without it, the other tactics fall apart when fear peaks.
Historical Perspective on Market Volatility

Looking backward shows that sharp volatility isn’t new, and markets have a track record of eventually moving past the chaos.
Past episodes offer context and lessons. On October 19, 1987, the Dow Jones Industrial Average dropped 22.6 percent in a single day, the largest one‑day percentage decline on record. The cause was a mix of program trading, portfolio insurance strategies, and a liquidity crunch. The dot‑com bubble peaked in March 2000 and then unwound over two years. The Nasdaq Composite lost roughly 78 percent from peak to trough by October 2002.
The 2007–2009 global financial crisis saw the S&P 500 fall about 57 percent from its October 2007 high to the March 2009 low, driven by subprime mortgage failures, bank collapses, and a credit freeze. In early 2020, COVID‑19 lockdowns triggered a 34 percent decline in the S&P 500 from February 19 to March 23, 2020, followed by a rapid recovery fueled by unprecedented monetary and fiscal support.
Each event reshaped how investors think about risk and how regulators respond. The 1987 crash led to circuit breakers that halt trading if indices fall too fast. The dot‑com bust reminded everyone that high valuations without earnings eventually collapse. The 2008 crisis overhauled bank capital requirements and taught investors to watch credit spreads and liquidity conditions, not just equity prices.
The 2020 shock proved that fiscal and monetary firepower can stabilize markets faster than anyone expected, but it also left debates about inflation and debt that still drive volatility today. The enduring pattern is simple: volatility spikes during uncertainty, peaks when fear overwhelms logic, and then subsides as information improves and buyers step back in. Staying invested through those cycles, rather than selling into panic, has historically been the better long‑term bet.
Final Words
You’ve learned that market volatility is how fast prices swing, how it’s measured (VIX, implied vs historical, standard deviation), and why it matters for risk and opportunity.
You saw common causes, current trends, and past spikes, plus simple tactics: spread your money across assets, dollar-cost averaging, periodic rebalancing, and focusing on the long term.
If these match your goals and timeline, use them to handle market volatility without panic. It won’t stop swings, but it can help you stay steady and keep progressing.
FAQ
Q: What is meant by market volatility?
A: Market volatility means how quickly and how much asset prices move, with higher volatility showing larger price swings and greater uncertainty for investors.
Q: Is high volatility good or bad?
A: High volatility is not simply good or bad; it means bigger price swings that raise the chance of larger losses and also the chance of larger gains, so it increases both risk and opportunity.
Q: Why is the market so volatile today?
A: The market is so volatile today because uncertainty from interest rate moves, inflation reports, geopolitical events, or earnings surprises is making investors react and prices swing sharply.
Q: Is 20% volatility high?
A: A 20% volatility reading is generally considered high, indicating large annualized price swings and elevated short-term risk that investors should match to their goals and time frame.

