

Think investing is just about finding the next hot stock? It’s not.
Ignoring risk is the quickest way to derail your goals.
This post lays out the key risks every investor should know, like market swings, inflation, liquidity, credit, interest rate moves, currency and political shocks, and why they matter to your timeline and peace of mind.
You’ll get simple rules to match risk to your goals, actions to protect your money, and what to expect when markets wobble.
Read on so your plan survives the bad years.
Core Risks in Investing Explained for Beginners

Understanding investment risks isn’t optional. It’s the difference between a plan that survives bad years and one that falls apart the first time markets drop. Every investment carries some level of uncertainty, and knowing what you’re signing up for helps you sleep at night when prices swing.
Higher expected returns typically require accepting higher volatility and greater potential for loss. An ETF tracking the S&P 500 might climb 15 percent one year and fall 10 percent the next. An emerging market equity mutual fund can swing even wider, up 25 percent in a strong year and down 20 percent when currencies shift or local economies stumble. Modern Portfolio Theory formalizes this tradeoff: if you want bigger gains over time, you have to be ready for bigger bounces along the way.
Investment risk means you can lose money, either part of what you put in or all of it. There are no guarantees of getting anything back. FINRA defines risk as any uncertainty that can negatively affect your financial welfare. Your time horizon plays a huge role in how much risk you can handle. A 25 year old saving for retirement can ride out a decade of ups and downs. Someone retiring in three years cannot. Risk tolerance is how comfortable you feel watching your account balance drop. Risk capacity is how much you can afford to lose given your goals and timeline. They’re different, and both change over time.
The most common high level risks every beginner must know:
Market risk. The whole market can drop, dragging most investments down with it.
Inflation risk. Your returns might not keep up with rising prices, shrinking what you can actually buy.
Liquidity risk. You may not be able to sell an investment quickly without losing value.
Credit risk. A borrower or bond issuer might default and fail to pay you back.
Interest rate risk. Rising rates can push bond prices down and affect other assets.
Key Types of Investment Risk to Know

Market Risk
Market risk is the possibility that the entire market or a broad segment of it will decline, pulling your investments down even if the companies you own are doing fine. It’s also called systematic risk because it affects the system as a whole. Wars, recessions, and sudden interest rate hikes can all trigger widespread selling.
In March 2020, global stock markets fell roughly 30 percent in a matter of weeks as COVID lockdowns began. Investors holding diversified index funds still saw their balances drop sharply, even though they owned hundreds of healthy companies.
Interest Rate Risk
Interest rate risk is the danger that rising rates will reduce the market value of your existing bonds and other fixed income investments. When new bonds offer higher yields, older bonds paying lower rates become less attractive, so their prices fall.
Imagine you hold a bond paying 3 percent interest. If new bonds start paying 4 percent, buyers will only purchase your 3 percent bond at a discount to make up for the lower income stream. The longer the bond’s maturity, the bigger the price swing when rates move.
Credit Risk
Credit risk is the chance that a borrower will fail to make interest payments or return your principal. We’re talking corporations, municipalities, governments. Bonds with higher default probability pay higher interest rates to compensate you for that extra danger.
A corporate bond rated BB by S&P Global might yield 6 percent while a AAA rated government bond yields 2 percent. The extra 4 percent is your reward for accepting the risk that the BB company might go bankrupt and leave bondholders with pennies on the dollar.
Inflation Risk
Inflation risk is the erosion of your purchasing power when your investment returns fail to keep pace with rising prices. Low risk assets like savings accounts and short term government bonds often deliver returns that barely beat inflation. Or fall behind entirely.
If your money market fund pays 2 percent and inflation runs at 3 percent, you’re losing 1 percent of real buying power each year. Over a decade, that compounds into a meaningful loss in what your money can actually purchase.
Liquidity Risk
Liquidity risk means you might struggle to sell an asset quickly at a fair price when you need cash. Real estate, collectibles, and thinly traded bonds can take weeks or months to sell. Rushing a sale often forces you to accept a steep discount.
A rental property worth $300,000 in a normal market might fetch only $250,000 if you need to sell within two weeks. Stocks and exchange traded funds are highly liquid. You can usually sell in seconds during market hours. But hard assets require time, paperwork, and often price concessions.
Currency Risk
Currency risk, or exchange rate risk, arises when you invest in foreign assets and currency movements shift your returns. A European stock might rise 10 percent in euros, but if the euro falls 8 percent against the dollar while you hold it, your dollar denominated gain shrinks to around 2 percent.
In 2022, the U.S. dollar strengthened sharply against most major currencies. American investors holding international stocks saw their foreign gains partly or fully erased when converting those returns back into dollars.
Political and Regulatory Risk
Political risk is the danger that government actions will harm your investments. Elections, new regulations, tax changes, trade wars, instability. A new tariff can crater an exporting industry overnight. A policy shift can wipe out a sector’s profitability.
When China tightened regulations on private education companies in 2021, shares of major tutoring firms fell more than 90 percent in a matter of days. Investors holding those stocks lost nearly everything, not because the businesses failed operationally, but because the government rewrote the rules.
Sequence of Returns Risk
Sequence of returns risk is the danger that the order in which you experience gains and losses will materially affect how long your money lasts, especially when you’re making withdrawals. Taking money out during a downturn locks in losses and leaves less capital to recover when markets rebound.
Two retirees starting with identical portfolios and identical average annual returns can end up with vastly different outcomes if one retires into a bear market and the other into a bull market. The retiree who withdraws during falling prices depletes the account faster, even if long term returns eventually equalize.
Systematic vs. Unsystematic Risk
Systematic risk affects the entire market and can’t be diversified away. Recessions, interest rate cycles, and geopolitical shocks hit almost everything. Unsystematic risk is specific to a single company or industry and can be reduced by spreading your money across many different investments.
A tech company’s earnings miss is unsystematic risk. Owning 50 companies instead of one smooths out those individual shocks. A global recession is systematic risk. Even a perfectly diversified portfolio will likely fall when the whole market drops.
Comparing Asset Classes by Risk Level
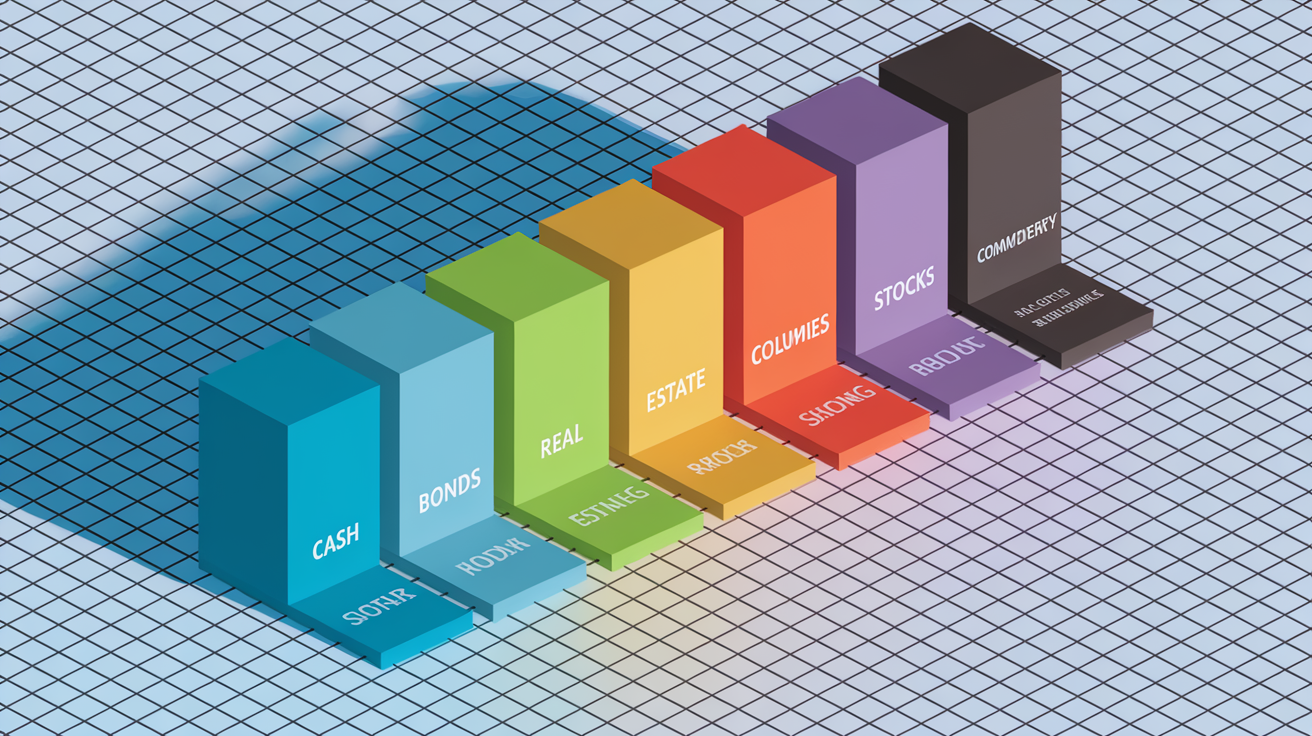
Different asset classes carry distinct risk profiles. Understanding those differences helps you build a portfolio that matches your timeline and tolerance. Stocks deliver higher long term returns on average but swing wildly day to day. Bonds provide steadier income but face interest rate and credit pressures. Cash avoids short term volatility but loses purchasing power to inflation.
| Asset Class | Primary Risk | Example Risk Scenario |
|---|---|---|
| Stocks | Market volatility | Portfolio drops 20% in a recession; takes years to recover |
| Bonds | Interest rate and credit risk | Fed raises rates 2%; your bond fund loses 10% in value |
| Cash / Money Market | Inflation erosion | Account yields 1.5%; inflation runs 3%; real loss every year |
| Real Estate | Liquidity and market cycles | Property value falls 15% and takes 6 months to sell at discount |
| Commodities | Price volatility and storage | Oil futures swing 30% in a month; holding costs accumulate |
| Cryptocurrency | Extreme volatility and regulatory | Coin drops 50% in days; new regulation bans trading platforms |
Diversification across these asset classes reduces the chance that a single type of risk will wreck your entire portfolio. When stocks fall, bonds may hold steady or even rise if investors flee to safety. When inflation surges, commodities and real estate often perform better than cash. Spreading your money among multiple asset classes smooths out the ride and improves the odds of meeting your long term goals without catastrophic losses along the way.
Portfolio Diversification and Protective Measures

Diversification is spreading your money across different investments so that a problem in one area doesn’t sink your whole portfolio. Owning 10 stocks instead of one reduces the damage when a single company misses earnings or faces a lawsuit. Owning both stocks and bonds cushions the blow when the stock market drops, because bonds often move differently. The goal is to take an appropriate level of risk for the returns you need, not to avoid all risk entirely.
Asset allocation is the specific mix you choose. 50 percent stocks and 50 percent bonds, or 80 percent stocks and 20 percent bonds, or any other combination that fits your timeline and tolerance. A balanced 50/50 mix offers moderate growth with some stability. An aggressive portfolio might hold 80 percent or more in stocks, accepting bigger swings for higher long term returns. A conservative portfolio tilts toward bonds and cash, sacrificing growth to protect principal. Your allocation should match how soon you need the money and how much volatility you can handle emotionally and financially.
As you age or your goals change, you adjust the mix to stay aligned. A 30 year old saving for retirement might start with 90 percent stocks and shift gradually to 60 percent stocks and 40 percent bonds by age 60, then move even more conservative as withdrawals begin. Rebalancing means selling a bit of what has grown and buying what has lagged to bring your portfolio back to the target percentages, typically once or twice a year. This forces you to sell high and buy low in a disciplined way.
A simple beginner friendly diversification procedure:
Decide your stock to bond ratio based on how many years until you need the money. Longer time horizons can handle more stocks.
Within stocks, spread across at least three sectors (technology, healthcare, consumer goods, etc.) and consider adding international exposure.
Within bonds, mix maturities and credit qualities. Some short term, some intermediate, and a range from high quality government bonds to investment grade corporate bonds.
Set a calendar reminder every six months to check if any asset has drifted more than 5 percent from your target allocation, and rebalance by selling the excess and buying the shortfall.
Revisit your overall plan annually or when life changes. New job, marriage, kids, approaching retirement. Adjust the allocation to match your current situation.
How Interest Rate, Credit, and Liquidity Risks Impact Investors
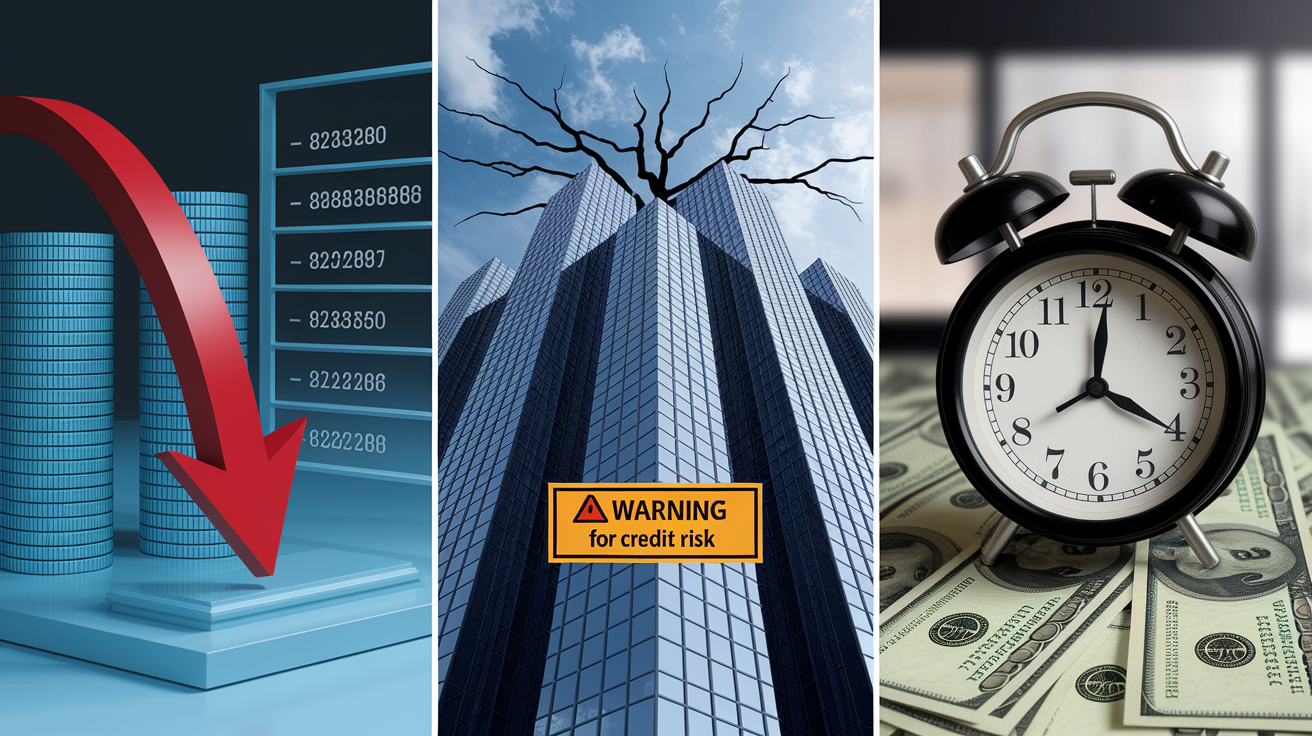
When the Federal Reserve raises interest rates from 2 percent to 4 percent over 18 months, a bond fund holding longer duration bonds can lose 10 to 15 percent of its market value even though the bonds themselves are still paying their promised coupons. If you need to sell during that period to cover an emergency expense, you lock in that loss. If you can hold the bonds to maturity, you still get your principal back. But in the meantime your account statement shows red. This is why rising rate environments hurt bond investors, especially those who didn’t plan for the possibility and need access to cash on short notice.
A corporate bond rated BBB by S&P Global might look attractive with a 5 percent yield when AAA government bonds pay 2 percent. That extra 3 percent compensates you for the higher chance the company defaults. If the company’s cash flow weakens or debt load grows, the rating agencies might downgrade the bond to BB or lower, and the market price can drop sharply as investors demand an even higher yield for the increased default probability. Credit risk isn’t abstract. It shows up as real losses when companies miss payments or file for bankruptcy, leaving bondholders fighting for pennies in restructuring.
Real estate and thinly traded bonds can sit on the market for weeks or months if you need to sell quickly. Urgent sales often require accepting a price well below fair value. A rental property appraised at $400,000 might fetch only $350,000 if you post a two week deadline because serious buyers know you’re desperate and will lowball their offers. Liquidity risk forces you into bad deals when life throws a curveball. Medical bills, job loss, urgent family needs. Keeping an emergency fund in a savings account or money market fund means you never have to fire sale illiquid assets at the worst possible moment.
Behavioral Risks and Emotional Decision Making

Markets drop, you see your balance shrink, panic sets in, and you sell everything to stop the pain. Then markets recover a few months later, and you’re sitting in cash watching everyone else make back their losses while you locked yours in permanently. Emotional investing turns temporary market volatility into permanent financial damage. Selling during a downturn feels like protecting yourself, but it’s usually the exact moment you should be holding steady or even buying more at lower prices.
Trying to time the market sounds smart but almost never works for regular investors. Jumping in when things look good and jumping out before the next drop. Professional traders with algorithms and instant data struggle to time correctly. A beginner checking prices once a day has no realistic shot. The math is brutal: miss just the 10 best days over a 20 year period and your total return can fall by half compared to staying invested the whole time. You never know which days will be the big up days, and they often happen right after the biggest down days when fear is highest and you’re most tempted to bail.
Habits that reduce emotional investing mistakes:
Set up automatic monthly transfers so you invest the same amount regardless of whether the market is up or down that week.
Avoid checking your portfolio balance more than once a quarter unless you’re actively rebalancing.
Write down your plan and your reasons for each investment before you buy, then review that list before selling to remind yourself why you started.
Keep enough cash in an emergency fund (three to six months of expenses) so a short term market drop doesn’t force you to sell investments to pay rent or fix the car.
Tools to Measure and Analyze Risk

Standard deviation is a statistical measure of how much an investment’s returns bounce around its average. A stock with an average annual return of 8 percent and a standard deviation of 15 percent will typically see annual returns ranging from negative 7 percent to positive 23 percent about two thirds of the time. Higher standard deviation means more unpredictable year to year results, which translates into higher risk for short term investors but can be acceptable for someone with a 20 year horizon who can ride out the swings.
Risk adjusted return metrics like the Sharpe ratio compare how much return you earn per unit of volatility. A fund returning 10 percent with a standard deviation of 20 percent has a Sharpe ratio of 0.5 (assuming zero risk free rate for simplicity). Another fund returning 8 percent with a standard deviation of 10 percent has a Sharpe ratio of 0.8, meaning it delivers more return for each point of risk taken. These tools help you compare investments on a level playing field rather than chasing the highest raw return without considering how bumpy the ride will be.
Reading a Prospectus for Risk Signals
Every mutual fund and ETF publishes a prospectus or Key Information Document that summarizes the investment strategy, fees, and risks. The risk section lists specific dangers. Currency exposure, concentration in a single sector, use of leverage, credit quality of bonds held. Look for plain language warnings like “this fund may experience significant volatility” or “the fund invests in lower rated securities with higher default risk.” Fee tables show expense ratios and transaction costs. Higher fees eat into returns and compound over decades. Performance history shows past volatility, though it doesn’t predict future results. Spending 10 minutes reading a prospectus before you invest can save you from surprises when markets turn.
| Metric | What It Measures |
|---|---|
| Standard Deviation | How much returns vary around the average; higher = more volatility |
| Sharpe Ratio | Return earned per unit of risk; higher = better risk-adjusted performance |
| Beta | Sensitivity to overall market moves; 1.0 = moves with market, above 1.0 = more volatile |
Building a Risk Aware Investment Plan for Beginners

Your time horizon is the foundation of every risk decision. Money you need in two years for a house down payment should sit in something stable. A high yield savings account or short term bond fund. You can’t afford a 20 percent drop right before you need to write the check. Money you won’t touch for 30 years can ride out multiple recessions and benefit from stocks’ higher long term returns. Match the risk level of each goal to its timeline, not to your general feelings about risk.
Capital preservation strategies become critical as you approach a spending goal. A retirement portfolio might start 90 percent stocks at age 30, shift to 70 percent stocks at 50, then move to 50 percent stocks and 50 percent bonds by age 65. Some retirees shift even further into bonds and dividend paying stocks to generate income and reduce the chance that a market crash in the first few retirement years depletes savings too quickly. The closer you are to needing the money, the less you can afford to gamble on a quick recovery.
Robo advisors automate the heavy lifting. They assess your risk tolerance with a questionnaire, build a diversified portfolio of low cost index funds, and rebalance automatically when allocations drift. Platforms charge a small annual fee (often 0.25 percent) on top of the fund expenses, which is cheaper than most human advisors and removes the temptation to tinker emotionally. You still need to maintain an emergency fund outside the investment account so you never have to sell during a downturn to cover an unexpected bill.
A starter plan from goal setting to periodic review:
Write down each financial goal with a target amount and a target date. Retirement in 30 years, car down payment in 3 years, college fund in 15 years.
Assign a risk level and asset allocation to each goal based on its time horizon. Long term goals get more stocks, short term goals get more bonds and cash.
Open accounts (IRA for retirement, taxable brokerage for other goals) and set up automatic monthly contributions you can sustain even during a bad month.
Choose low cost index funds or ETFs that match your allocation. Total stock market fund, total bond market fund, international stock fund. Buy according to your plan.
Review your portfolio every six months to rebalance if any asset class has drifted more than 5 percent from target, and revisit your overall plan annually or whenever a major life event (job change, marriage, new baby) shifts your timeline or risk capacity.
Final Words
in the action this guide pulled together what matters: what investment risk is, common risk types, how different assets stack up, and simple ways to protect your money like diversification and rebalancing.
Next, we showed how interest-rate, credit, liquidity, and behavior can hurt returns, and shared basic tools and a beginner plan you can follow today.
Keep it simple: set a time horizon, keep an emergency fund, automate contributions, and check your plan once a year. Understanding risks investing helps you stick with a steady plan and feel more confident.
FAQ
Q: What are some risks in investing? How many and which financial risks should I know?
A: The main risks in investing include market risk (price swings), inflation (purchasing power loss), liquidity risk (hard to sell), credit/default risk, interest-rate risk, currency or political/regulatory risk, and concentration/sequence-of-returns risk.
Q: How much money do I need to invest to make $3,000 a month?
A: How much you need to invest to make $3,000 a month depends on expected returns; using a 4% withdrawal rule you’d need about $900,000, or about $720,000 at a 5% yield (with more risk).
Q: How much will $10,000 invested be worth in 10 years?
A: How much $10,000 will be worth in 10 years depends on the annual return; for example, at 5% it’s about $16,289, at 7% about $19,672, and at 10% about $25,937.

