

Would you buy a bond ETF that lost a third of its value in a stress test?
If you’re building a conservative portfolio, you shouldn’t have to guess.
This post gives a simple, measurable checklist for comparing bond ETFs, covering fees, fund size, duration, credit quality, liquidity, and realistic yields, so you can rank funds without marketing noise.
Use these checks to pick ETFs that protect capital, pay steady income, and trade smoothly when markets get messy.
Here’s a practical way to cut emotion and choose funds that match your time frame and risk.
Core Comparison Criteria for Bond ETFs in Conservative Portfolios
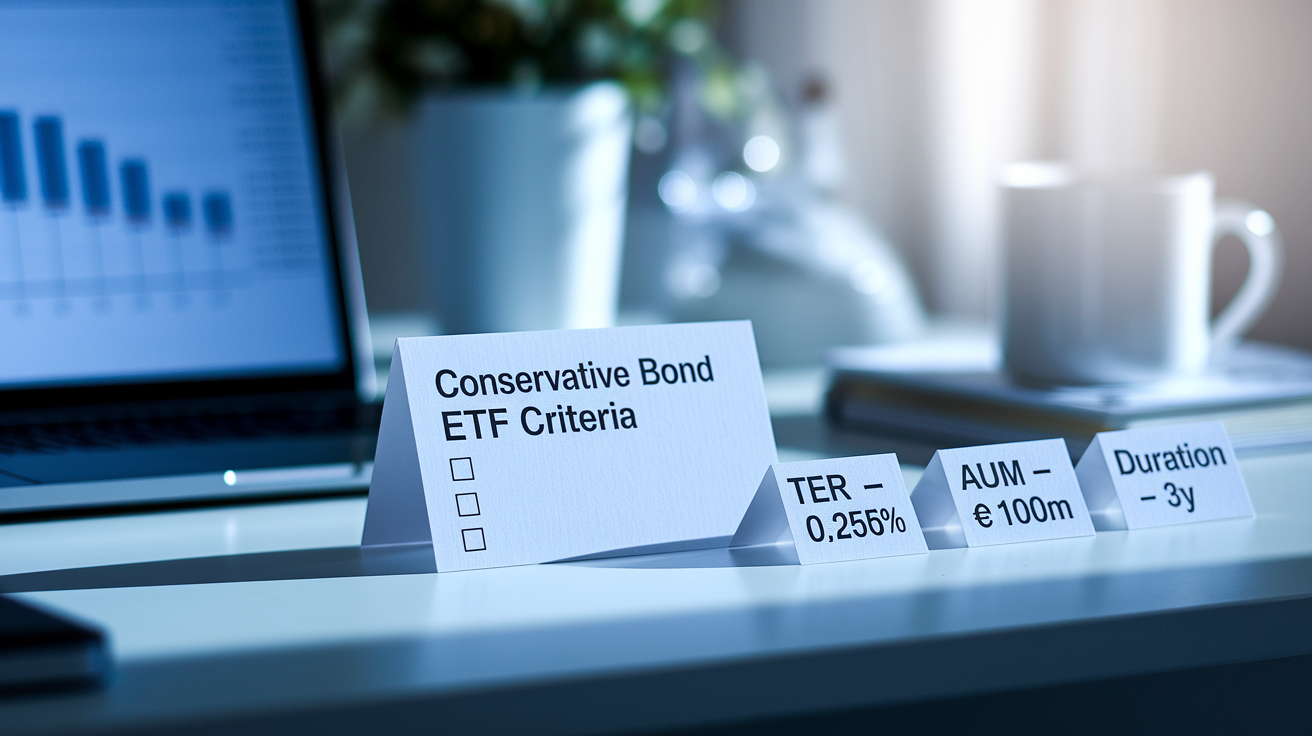
Conservative investors need a straightforward way to evaluate bond ETFs without relying on guesswork or marketing fluff. You’re looking for funds that protect capital, deliver consistent income, and don’t blow up during market stress. A measurable checklist takes emotion out of the equation and keeps you focused on numbers that actually matter for risk and return.
Start with funds that charge a Total Expense Ratio at or below 0.25 percent, hold at least €100 million in assets, and stick to investment-grade credit quality (AAA to BBB). Keep duration under 3 years if capital preservation is your priority. Bid-ask spreads should stay below 0.10 percent, and skip anything with less than three years of history. These filters cut through the noise and point you toward ETFs built for stability.
Use these categories to compare any bond ETF against conservative benchmarks:
- Total Expense Ratio (TER) – what the fund charges you each year, aim for 0.25 percent or less on government bond ETFs.
- Assets Under Management (AUM) – how big the fund is, minimum €100 million to lower the odds it’ll shut down.
- Modified Duration – how much the price moves when rates change, keep it under 3 years for conservative portfolios.
- Average Maturity – how long until the bonds pay back principal, shorter means less volatility.
- Weighted Average Credit Rating – stick to investment grade (BBB-/Baa3), but A or AA is better for real safety.
- Percentage Investment-Grade – how much of the fund sits in BBB- or higher, target at least 95 percent.
- Yield-to-Worst (YTW) – what you can realistically expect to earn, accounting for price and maturity.
- SEC Yield / 12-Month Trailing Yield – standardized income number after expenses.
- Average Daily Trading Volume – shows liquidity, prefer over €0.5 to 1.0 million.
- Bid-Ask Spread – what you pay to trade, target under 0.10 percent (10 basis points).
- Tracking Error – how far the fund drifts from its benchmark, expect under 0.25 percent for simple government ETFs.
- Top-10 Issuer Concentration – diversification check, keep it under 30 percent so one borrower can’t sink you.
These numbers give you a solid foundation for side-by-side comparisons and help you rank funds by cost, risk, and fit for conservative income.
Duration, Maturity, and Interest-Rate Sensitivity When Comparing Bond ETFs

Duration tells you how much a bond ETF’s price will swing when interest rates move. A fund with a modified duration of 5.0 years will gain about 5 percent if rates drop 1 percent, and lose 5 percent if rates climb 1 percent. Short-duration ETFs show smaller price moves, which makes them the obvious pick for conservative portfolios focused on protecting capital and staying liquid.
Maturity buckets help you sort out the risk ladder. Short-duration funds hold bonds maturing in 0 to 3 years, so they act more like cash and barely flinch when rates shift. Intermediate funds (5 to 7 years) offer higher yield but more volatility. Long-duration funds (10+ years) amplify everything, both gains when rates fall and losses when they spike. Real-world stress tests make the difference clear: during the 2022–2023 inflation shock, a short government bond ETF dropped 2.3 percent while a long-duration fund fell 34 percent. Before the Fed pivoted, investors holding long bonds watched a third of their capital disappear while short-duration peers weathered it with single-digit losses.
When you’re comparing bond ETFs, check these duration and maturity factors:
- Short Duration (0–3 years) – barely moves with rates, capital preservation comes first, works for near-term cash needs.
- Intermediate Duration (5–7 years) – moderate rate risk, higher yield, fits balanced income portfolios.
- Long Duration (10+ years) – high rate sensitivity, maximum volatility, only for aggressive bond plays.
- Modified Duration Threshold – conservative investors should keep duration under 3 years to limit drawdowns.
- Average Maturity Alignment – match the fund’s average maturity to when you’ll need the cash (2-year need = 2-year average maturity).
Conservative portfolios typically skip long-duration funds and stick to the short bucket to cut interest-rate exposure and protect principal during rate-hiking cycles.
Evaluating Credit Quality and Issuer Exposure in Bond ETF Comparisons
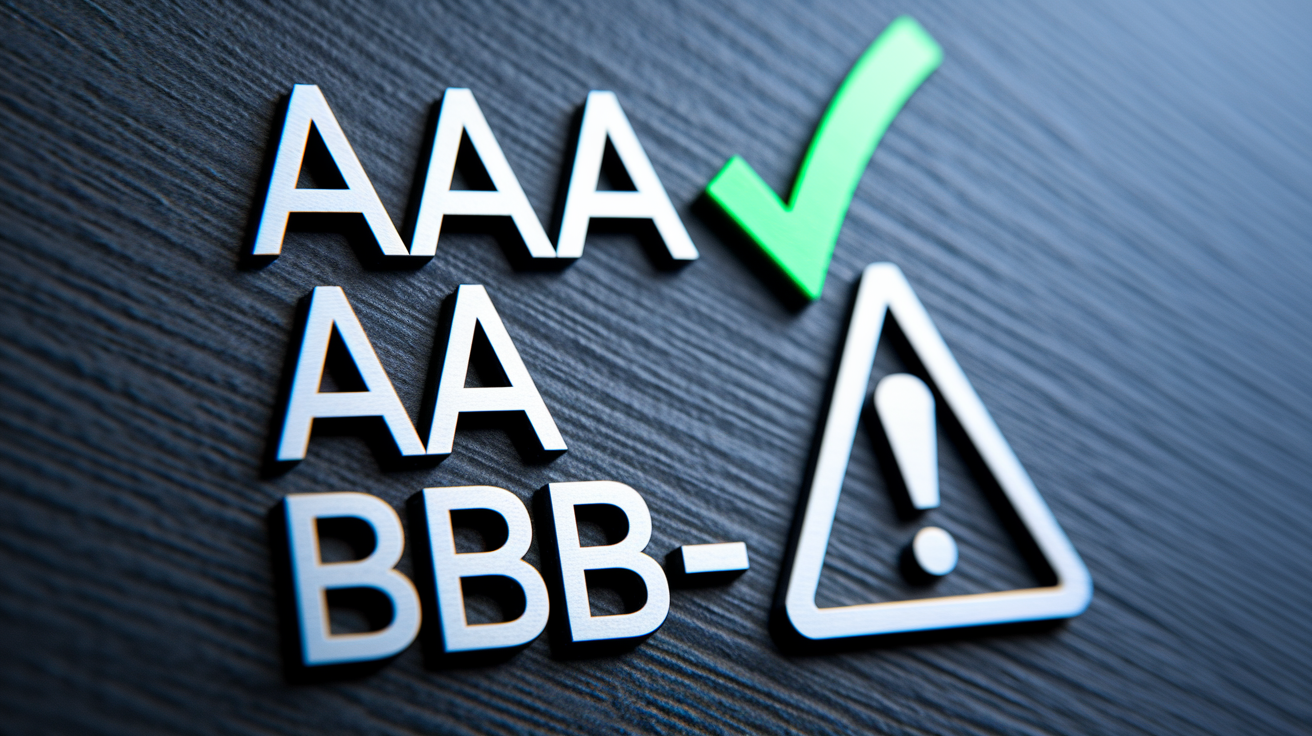
Credit quality determines whether bond issuers will actually pay you back on time. Conservative investors focus on funds with weighted average credit ratings in the A to AA range, or at minimum, investment-grade (BBB-/Baa3 and above). Lower ratings mean more risk of defaults, downgrades, and bigger price drops during economic trouble. Government bond ETFs usually carry the highest credit quality since they’re backed by sovereign issuers, while investment-grade corporate funds add yield by taking on slightly more default risk.
Look for the fund’s Weighted Average Credit Rating in the fact sheet or prospectus. A fund rated ‘AA’ is much safer than one rated ‘BB,’ which sits below investment-grade and signals higher default odds. Conservative portfolios should avoid high-yield (junk) bonds unless you’re explicitly chasing higher income and okay with equity-like volatility. Even small allocations to below-investment-grade debt (above 10 percent of the fund) can introduce nasty surprises during recessions when defaults spike.
Issuer concentration shows how much of the fund sits in the top 10 borrowers. You want funds where the top-10 holdings represent less than 30 percent of total assets. High concentration in a few issuers (governments, corporations, or agencies) means a single downgrade or default hits harder. Diversification across hundreds of issuers spreads risk and smooths returns. Government ETFs naturally show less issuer risk because of sovereign backing, but corporate bond funds need closer inspection to make sure no single company dominates and creates hidden exposure.
Yield, YTW, SEC Yield, and Real Return: Key Yield Metrics for ETF Comparison

Distribution yield alone can fool you because it only shows the most recent payout without accounting for price changes or future income. Yield-to-Worst (YTW) and SEC yield give you forward-looking estimates that include coupon payments, purchase price, and maturity assumptions. YTW assumes the worst-case call or maturity scenario, so it’s a conservative return estimate. SEC yield standardizes calculations across funds, which lets you compare apples to apples after expenses.
Municipal bond ETFs make yield comparisons trickier because their income is typically exempt from federal taxes, and sometimes state and local taxes depending on the issuer and where you live. To compare a municipal ETF to a taxable corporate or government ETF, convert the tax-free yield into a taxable-equivalent yield using this formula: Tax-Equivalent Yield = Tax-Free Yield / (1 – Your Marginal Tax Rate). For example, a municipal ETF yielding 2.00 percent at a 32 percent marginal tax rate equals a taxable-equivalent yield of 2.94 percent, making it competitive with a corporate ETF yielding 3.0 percent before taxes.
| Metric | What It Measures | Why It Matters |
|---|---|---|
| Distribution Yield | Most recent payout annualized | Backward-looking; doesn’t predict future income |
| Yield-to-Worst (YTW) | Conservative estimate assuming worst call/maturity | Forward-looking; accounts for price and reinvestment |
| SEC Yield | Standardized 30-day yield after expenses | Apples-to-apples comparison across funds |
| Tax-Equivalent Yield | Municipal yield adjusted for tax savings | Compares tax-free vs taxable income fairly |
Always compare yield after the expense ratio and on the same duration basis. A fund with 3.0 percent YTW and 0.20 percent TER delivers 2.8 percent net yield, which might trail a competitor offering 2.9 percent YTW and 0.05 percent TER (2.85 percent net). Small differences add up over years, especially in conservative portfolios where every basis point counts.
Liquidity, AUM, Bid–Ask Spreads, and ETF Trading Quality

Liquidity determines how easily you can buy or sell shares at a fair price without moving the market. Bond ETFs with large Assets Under Management and high daily trading volume offer tighter bid-ask spreads and better price discovery. Look for funds with AUM above €100 million (ideally €500 million or more) to cut the risk of fund closure and ensure enough market interest for smooth trading.
Average daily trading volume above €0.5 to 1.0 million in secondary-market shares signals active investor interest and competitive pricing. Bid-ask spreads should stay below 0.10 percent (10 basis points) for liquid government bond ETFs. Wider spreads (above 25 basis points) mean poor liquidity and higher transaction costs. During market stress, even well-traded ETFs can experience temporary price dislocations when underlying bond trading volumes dry up. The 2020 COVID-19 crisis saw corporate bond ETF spreads widen sharply as dealers pulled back, causing ETF market prices to fall below Net Asset Value and forcing patient investors to wait for spreads to normalize. Before the Fed intervened, some investment-grade corporate ETFs traded 5 percent below their holdings’ value, punishing sellers who needed immediate liquidity.
Monitor these liquidity and trading-quality factors when comparing bond ETFs:
- AUM threshold – stick to funds above €100 million; avoid anything below €50 million because of closure risk.
- Average daily share volume – target over €0.5 to 1.0 million to ensure active secondary markets.
- Bid-ask spread – check real-time spreads when you trade; conservative target under 0.10 percent.
- Underlying bond liquidity – government bonds trade more actively than corporate or municipal bonds, which improves ETF spreads.
- Creation/redemption mechanism – larger AUM and established index footprints support authorized participants who keep ETF prices aligned with Net Asset Value.
- Stress-period behavior – review how spreads and premium/discount patterns behaved during past crises to understand worst-case execution costs.
Small, illiquid ETFs might look good on paper but can cost you more in hidden transaction expenses and forced holding periods when you need to sell.
Index Methodology, Tracking Error, and Total ETF Costs

The index a bond ETF tracks shapes its holdings, turnover, and risk profile. Most government and corporate bond ETFs use cap-weighted indexes that allocate more to the largest borrowers, often governments with the most outstanding debt. This can concentrate exposure in heavy issuers. Strategic-beta ETFs and actively managed bond funds adjust duration or tilt toward higher credit quality to cut interest-rate or default risk, but they typically charge higher expense ratios to cover active management or custom index licensing.
Tracking error shows how closely an ETF follows its benchmark. For simple government bond ETFs, expect tracking error below 0.25 percent annually. Higher tracking error signals operational friction: transaction costs from rebalancing, cash drag, or differences in underlying bond prices versus index assumptions. Funds with frequent rebalancing or high turnover (above 50 percent annually) rack up more trading costs that chip away at returns. Conservative investors should look for turnover below 25 percent to minimize hidden costs and tax inefficiency in taxable accounts.
Total cost of ownership includes three layers: the stated expense ratio (TER), tracking error, and bid-ask spreads. A fund charging 0.08 percent TER but delivering 0.20 percent tracking error and 0.10 percent spreads costs you 0.38 percent in total. Compare two ETFs with similar duration and credit profiles by adding all three cost components. The fund with the lowest total cost will deliver higher net returns over time, assuming comparable risk. Even a 0.15 percent annual cost advantage compounds into real savings. Over ten years, a €100,000 investment earning 2.5 percent annually with 0.25 percent total costs grows to €127,900, while the same return with 0.40 percent costs yields only €126,700—a €1,200 difference from a seemingly small fee gap.
Historical Volatility, Drawdowns, and Stress-Test Factors for ETF Comparison

Historical performance shows how bond ETFs behave during market stress. Maximum drawdown (the largest peak-to-trough decline) reveals worst-case capital loss over a given period. Conservative short-duration government bond ETFs typically show maximum drawdowns below 5 percent during 12-month stress windows, while long-duration funds can lose 30 percent or more during sharp rate-hiking cycles. The 2022–2023 inflation shock made the gap crystal clear: short-duration ETFs fell 2.3 percent while long-duration funds dropped 34 percent. Before rates stabilized, retirees holding long bonds for higher yield saw their principal evaporate while short-duration peers experienced minor, recoverable dips.
Annualized volatility measures how much returns bounce around. Conservative bond ETFs typically show 1 to 4 percent annualized volatility, compared to 15 to 20 percent for equities. Lower volatility supports capital preservation and cuts emotional stress during market turbulence. Correlation to equities is another key number. Bond ETFs with low or negative correlation provide better diversification during stock market selloffs. Government bonds historically show lower correlation to equities than corporate bonds, making them the preferred defensive choice.
Review these stress-test and volatility factors when comparing ETFs:
- Maximum 12-month drawdown – conservative target under 5 percent for short-duration funds.
- Annualized price volatility – look for under 3 percent for conservative portfolios.
- Correlation to equity indexes – lower correlation gives you better diversification.
- Crisis-period performance – compare returns during the Global Financial Crisis, 2013 Taper Tantrum, and 2020 COVID-19 stress to understand defensive payoff variability.
Focus on funds with proven stability during past rate shocks and equity bear markets to boost confidence that your bond allocation will protect capital when you need it most.
Tax Treatment, ETF Structure, and Suitability for Conservative Investors

Municipal bond ETFs offer federal tax-exempt income and sometimes state or local tax exemption depending on the issuer and where you live. To compare a municipal ETF to a taxable government or corporate fund, calculate the tax-equivalent yield using your marginal tax rate. A 2.0 percent municipal yield at a 32 percent tax rate equals a 2.94 percent taxable-equivalent yield, making it competitive with higher-yielding taxable funds for investors in high tax brackets. Municipal ETFs work best in taxable accounts, while taxable bond ETFs might be better suited for tax-advantaged retirement accounts where tax deferral already applies.
ETF structure provides tax efficiency through in-kind creation and redemption, which lets authorized participants exchange baskets of bonds directly with the fund without triggering taxable sales. This cuts portfolio turnover and defers capital gains, unlike mutual funds that have to sell holdings to meet redemptions and distribute gains annually. Accumulating share classes reinvest distributions automatically and defer taxable events, while distributing share classes pay income regularly and create annual tax reporting. Conservative investors in taxable accounts should lean toward accumulating ETFs or low-turnover funds to minimize annual tax drag and preserve compounding.
Practical Step-by-Step Checklist Workflow for Comparing Bond ETFs

Comparing bond ETFs systematically cuts out guesswork and points you toward funds that match conservative portfolio goals. Start by defining your target exposure: government bonds for maximum safety, investment-grade corporate for modest yield pickup, or municipal for tax efficiency. Use an ETF screener to build an initial longlist filtered by bond type, maturity range, region, and currency.
Follow these five steps to narrow the field and lock in your selection:
-
Screen by type, duration, and region – set dropdown filters to match your target exposure (e.g., Euro government bonds, maturity 0 to 3 years, region Europe). Generate a list of 10 to 20 candidate ETFs.
-
Apply culling rules – toss out funds with AUM below €100 million, TER above 0.25 percent, duration above 3 years (for conservative portfolios), investment-grade holdings below 95 percent, or track records shorter than 3 years. This removes illiquid, expensive, or unproven options.
-
Build metric comparison table – fill a spreadsheet with each remaining ETF’s ticker, AUM, TER, duration, credit rating, YTW, SEC yield, bid-ask spread, daily volume, tracking error, and top-10 issuer concentration. Sort by total cost (TER + tracking error + spread) and liquidity (AUM + volume).
-
Run scenario analysis – review historical max drawdown, annualized volatility, and crisis-period returns (2013 Taper Tantrum, 2020 COVID-19, 2022–2023 inflation shock). Find funds with the most stable downside behavior and lowest correlation to equities.
-
Finalize selection – rank the shortlist by total cost, stress-test performance, and tax efficiency. Pick the top 2 to 3 ETFs for deeper fund-literature review (prospectus, fact sheet, index methodology). Confirm the final pick meets all conservative thresholds before you buy.
Red flags that justify immediate exclusion include tracking error above 1 percent, material exposure to below-investment-grade debt (above 10 percent), complex derivative usage without clear collateralization, or average daily volume below 10,000 shares with AUM under €50 million. These signals point to operational friction, hidden risk, or illiquidity that conflicts with conservative capital-preservation goals. Revisit your checklist quarterly to watch for changes in AUM, spreads, and performance that might require rebalancing or switching to a better-matched ETF.
Printable / Downloadable Comparison Template for Bond ETF Analysis

A structured comparison template keeps you from missing critical details and lets you rank ETFs consistently. Use a spreadsheet with columns for each fund’s operational metrics, risk measures, and performance data. Include pass/fail thresholds for conservative portfolios so you can quickly spot funds that meet your standards and eliminate those that fall short.
| Field | Description | Data Type | Conservative Threshold |
|---|---|---|---|
| Ticker / ISIN | Unique identifier for the ETF | Text | N/A |
| Assets Under Management | Total fund size in euros | Number (€M) | ≥ €100M |
| Total Expense Ratio (TER) | Annual fee charged by fund | Percentage | ≤ 0.25% |
| Modified Duration | Interest-rate sensitivity in years | Number (years) | < 3 years |
| Weighted Average Credit Rating | Average credit quality of holdings | Text (rating) | ≥ BBB- (prefer A or AA) |
| Percentage Investment-Grade | Share of holdings rated BBB- or higher | Percentage | ≥ 95% |
| Average Bid-Ask Spread | Transaction cost indicator | Percentage | < 0.10% |
Add columns for Yield-to-Worst, SEC yield, distribution type (accumulating or distributing), currency, currency hedge status, region, bond type, average maturity, 1-year and 3-year returns, maximum drawdown, average daily trading volume, tracking error, top-10 issuer concentration, and notes on tax status or special features. Use filters to sort by total cost (TER + tracking error + spread) and liquidity (AUM + daily volume). Highlight funds that pass all conservative thresholds in green and flag those with red-flag metrics in red for immediate exclusion. Save the template as a CSV or Excel file so you can update it quarterly and track how your shortlist changes as market conditions and fund performance shift over time.
Final Words
We jumped straight into the actionable checklist: fees (TER), fund size, duration, credit quality, yield measures, liquidity, tracking error, stress performance, tax rules, and a printable template.
Now use the step-by-step workflow to screen funds, apply the numeric cutoffs, run a quick stress test, and narrow to 2–3 candidates. Set a simple review schedule and stick with it.
Use this checklist for comparing bond etfs for conservative portfolios as your working guide. It should make choosing safer options easier and more steady.
FAQ
Q: What is the 7% rule in ETF?
A: The 7% rule in ETFs is not a formal rule; some investors use it as a position-size guideline, keeping any single ETF near 7% of the portfolio to limit risk and boost diversification.
Q: What is the 3 5 10 rule for ETFs?
A: The 3 5 10 rule for ETFs is not universal; some people use it as a simple diversification check — 3 core asset classes, 5 funds, 10 total positions to keep a tidy, balanced mix.
Q: What did Warren Buffett say about bonds?
A: Warren Buffett said bonds provide safety and steady income but generally offer lower long-term returns than stocks; he warns against locking into long-term, low-yield bonds when rates are low.
Q: What is Warren Buffett’s favorite ETF?
A: Warren Buffett’s favorite ETF approach is a low-cost S&P 500 index fund; he recommends putting most equity money into a Vanguard S&P 500 index fund for broad, cheap market exposure.

