
Paying extra for an active ETF often feels like buying hope, not results.
But sometimes managers do add real value.
If you want a clear way to tell which is which, this checklist gives ten direct, measurable points—expense ratio, turnover, tracking error, tax history, liquidity and more—that you can pull from a fund fact sheet in under ten minutes.
Use it to decide if you’re paying for skill or for features you don’t need.
Simple, practical, and focused on what affects your returns and taxes.
Quick Comparison Checklist for Evaluating Active vs Passive ETFs
When you’re comparing ETFs, you need a simple filter to sort through noise and focus on what actually matters. Active and passive ETFs serve different purposes, carry different costs, and fit different parts of a portfolio. But the difference isn’t always obvious at first glance.
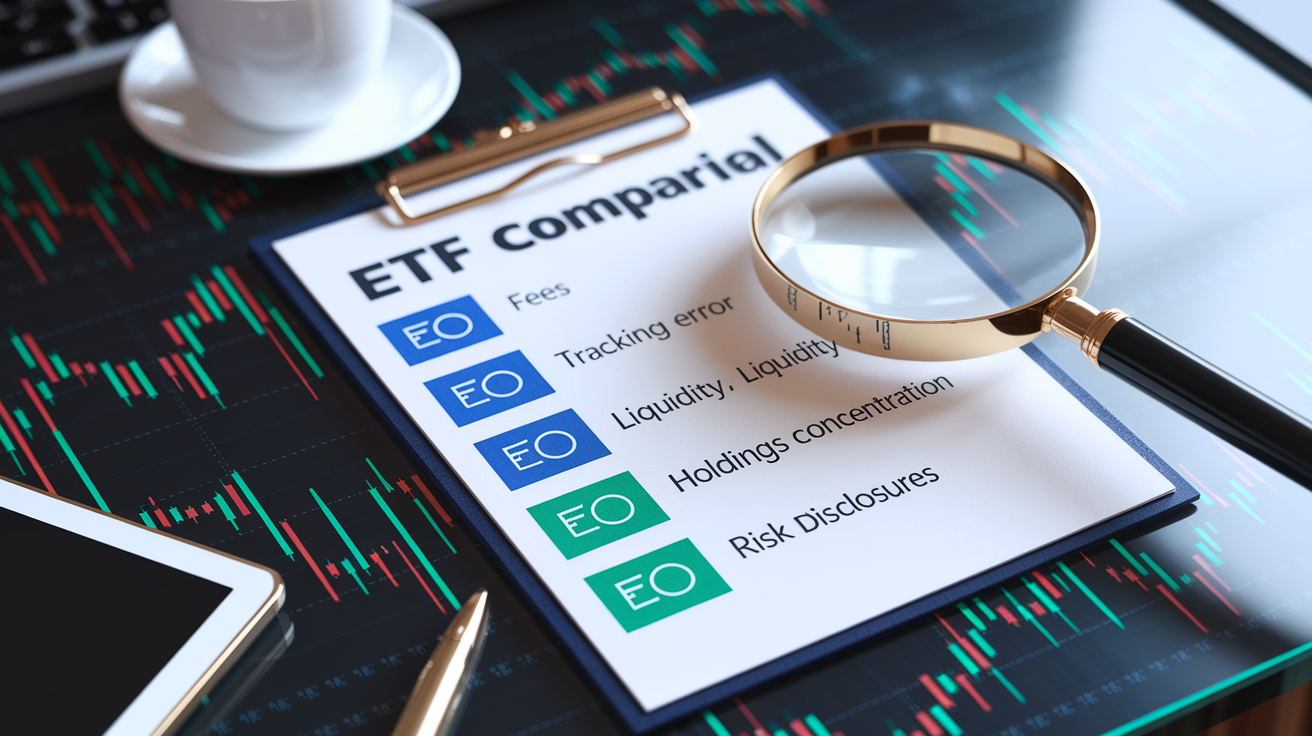
This checklist gives you ten direct evaluation points to compare any two funds side by side. Use it to decide whether you’re paying for manager skill that adds value or paying extra for features you don’t need. Each item ties to a measurable number or clear fund characteristic you can pull from a fact sheet, fund page, or screener in under ten minutes.
- Expense ratio: Write down the annual fee percentage for each fund.
- Tracking error (passive) or benchmark outperformance (active): Check how closely a passive fund follows its index, or how consistently an active fund beats its stated benchmark.
- Portfolio turnover percentage: Higher turnover means more trading costs and potential tax events.
- Historical capital gains distributions: Look at the past 12 to 24 months of actual payouts to investors.
- Assets under management (AUM): Larger funds tend to be more stable and liquid.
- Average daily trading volume: Higher volume makes it easier to buy or sell without moving the price.
- Bid‑ask spread: Narrow spreads reduce your real cost per trade.
- Manager tenure and team stability (active): Longer tenure suggests experience. Frequent changes raise a red flag.
- Top 5 or top 10 holdings concentration: High concentration increases single‑stock risk.
- Strategy complexity and risk disclosures: Check whether the fund uses options, leverage, derivatives, or other tools that add layers of risk.
Core Definitions and How They Influence the Evaluation Process

Passive ETFs are built to mirror an index. Examples include the S&P 500, Nasdaq‑100, or Russell 2000. The fund manager doesn’t pick individual stocks or try to time the market. Instead, the ETF holds the same securities as the index, in roughly the same weights, and adjusts only when the index itself rebalances.
This design keeps trading activity low, turnover low, and costs low. Passive funds aim for market returns, not outperformance.
Active ETFs rely on a portfolio manager or management team to make discretionary decisions about which securities to buy, sell, or hold. The manager may concentrate the portfolio in high‑conviction picks, shift sector weights based on research, or adjust exposure in response to market conditions.
The stated goal is to beat a benchmark index. But there’s no guarantee that’ll happen. Active ETFs typically charge higher fees to cover the cost of research, analysis, and trading, and you need to evaluate whether that extra expense is justified by the results.
Cost Structure Analysis: Expense Ratios, Turnover, and Hidden Costs

Expense ratio is the annual fee charged by the fund, expressed as a percentage of your investment. A passive ETF might charge 0.05 percent to 0.3 percent per year. An active ETF often charges between 0.5 percent and 1.5 percent or more.
That difference compounds over time. On a $100,000 portfolio growing at 7 percent annually, an extra 0.1 percent in fees reduces your ending balance by roughly $8,200 after 20 years.
Turnover measures how often the fund buys and sells holdings. Higher turnover means more trading commissions, wider bid‑ask spreads paid on each transaction, and potential securities transaction taxes. Active ETFs with turnover above 50 percent or 100 percent per year rack up implicit costs that don’t show up in the expense ratio line but still cut into your returns. Even if the fund generates strong gross returns, these trading costs eat into what you actually keep.
When you compare two ETFs, add up the stated expense ratio and estimate the drag from turnover and spreads. If an active fund charges 1 percent per year and has 80 percent turnover with a 0.1 percent average spread on each trade, your real annual cost can approach 1.2 percent. A passive fund charging 0.1 percent with 5 percent turnover and tight spreads may cost you closer to 0.12 percent all in.
That gap determines how much outperformance the active manager must deliver just to break even.
Performance Evaluation Beyond Simple Returns
Looking at a one‑year return number tells you what happened, not whether the fund did a good job getting there or whether the result is likely to repeat. A fund can post strong returns by taking excessive risk, concentrating in one hot sector, or getting lucky on a few large bets.
Performance evaluation means digging into consistency, volatility, and how much excess return the manager delivered per unit of risk taken.
Key Metrics for Assessing ETF Performance
Alpha measures whether the fund beat its benchmark after adjusting for market risk (beta). A passive fund tracking the S&P 500 should have near‑zero alpha and a beta close to 1.0. An active fund with positive alpha over three or five years is delivering value above what you could capture by simply holding the index.
Sharpe ratio divides excess return by volatility, giving you a single number to compare risk‑adjusted performance across funds. A Sharpe ratio above 1.0 is solid. Below 0.5 is weak. Downside deviation tells you how much the fund drops during bad periods. Lower is better.
When you compare an active fund to a passive alternative, check whether the active fund’s alpha and Sharpe ratio are high enough to justify the extra cost and complexity. If the active fund has similar or worse risk‑adjusted returns, the passive option is the simpler choice.
Risk Metrics and Portfolio Impact

Volatility shows how much a fund’s price bounces around day to day and month to month. Passive ETFs tracking broad indexes tend to match the volatility of that index. If the S&P 500 has annualized volatility around 15 percent, a passive S&P 500 ETF will be close to that. Active funds can have higher or lower volatility depending on the manager’s strategy.
A concentrated active fund with 30 holdings will swing more than a diversified passive fund with 500.
Concentration risk comes from holding a small number of large positions. If the top five holdings make up 40 percent of the portfolio, a problem in one or two stocks can drag down the whole fund. Passive ETFs spread risk broadly. Top‑five concentration in a total‑market ETF might be under 20 percent. Active funds often run higher concentration because managers want to back their best ideas. That can be fine if the picks work out, but it amplifies loss if they don’t.
Correlation with your existing holdings matters when you already own other funds or individual stocks. Adding a second large‑cap U.S. equity ETF that moves in lockstep with what you already hold doesn’t reduce risk. It just layers on more of the same exposure.
Check the overlap in holdings and sector weights. If your existing portfolio is heavy in tech and you’re considering an active ETF concentrated in tech, you’re doubling down on one risk, not diversifying it.
Tax Efficiency and Turnover Considerations

ETFs are generally more tax‑efficient than mutual funds because of the in‑kind redemption process, which allows the fund to shed low‑cost‑basis shares without triggering capital gains. But not all ETFs are equal on taxes.
Passive ETFs with low turnover rarely distribute capital gains. Many large passive U.S. equity ETFs have gone years without a taxable distribution. Active ETFs with high turnover trade more, realize gains more often, and may pass those taxable events to you even in years when you didn’t sell a single share.
Check the fund’s history of capital gains distributions over the past three to five years. If an active ETF has distributed significant gains annually, expect that pattern to continue. Compare that to a passive alternative with minimal or zero distributions.
For taxable accounts, the tax drag from distributions can offset a meaningful chunk of an active fund’s outperformance. Sometimes all of it. If you hold ETFs in a tax‑deferred account like an IRA or 401(k), distributions don’t create an immediate tax bill, so this factor matters less. Match the ETF type to the account type based on tax sensitivity.
Liquidity, Trading Behavior, and Tracking Error

Liquidity isn’t just about whether you can buy or sell. It’s about doing so without paying a hidden penalty in the form of a wide spread or market impact.
Average daily trading volume and assets under management both contribute to liquidity. A fund with $5 billion in AUM and 10 million shares traded per day is easier and cheaper to trade than a $200 million fund averaging 50,000 shares per day. Bid‑ask spread is the gap between the price at which you can buy and the price at which you can sell at the same moment. A spread of 0.02 percent is tight. A spread of 0.3 percent or wider means you’re giving up a noticeable slice of value on every round trip.
Tracking error matters primarily for passive ETFs. It measures how closely the fund’s return matches the index return. A tracking error below 0.1 percent is excellent. Above 0.3 percent suggests the fund isn’t doing its job cleanly. Tracking error can come from timing differences in rebalancing, cash drag from holding small amounts of uninvested cash, or fees.
Active ETFs don’t have a tracking error in the same sense. They’re trying to diverge from the index. But you can still measure how much the fund’s volatility and correlation differ from the benchmark to understand how much active risk the manager is taking.
| Factor | How It Affects Active ETFs | How It Affects Passive ETFs |
|---|---|---|
| Bid‑ask spread | Can be wider on smaller or niche‑strategy active funds; watch spreads above 0.2% | Typically tight on large, liquid index ETFs; spreads often under 0.05% |
| Tracking error | Not applicable; active funds aim to deviate from the index | Should be minimal; low tracking error confirms accurate index replication |
| AUM and volume | Lower AUM or volume can reduce liquidity and increase execution costs | Higher AUM and volume improve liquidity and keep spreads narrow |
| Premium or discount to NAV | May trade at larger premiums or discounts if strategy is less liquid or transparent | Typically trades very close to NAV due to efficient arbitrage and transparent holdings |
Choosing the Right ETF Type for Different Investment Goals

If your time horizon is five to ten years or longer and your goal is broad market exposure with minimal cost, passive ETFs are the default choice. You capture market returns, pay minimal fees, and avoid the risk that a manager makes poor calls or leaves the fund. This approach works well when you’re building a core portfolio and want predictable, consistent participation in equity or bond market growth without surprises.
Short‑term or tactical goals may favor active ETFs when you believe a specific strategy, sector, or manager can add value in the current environment. An active fund focused on dividend‑paying stocks might generate income and downside protection during volatile periods better than a broad index. An active small‑cap fund might exploit inefficiencies that are harder to capture with rules‑based indexing.
In these cases, you’re paying for specialized expertise and accepting higher fees in exchange for the possibility of outperformance or risk management that an index can’t deliver.
Risk tolerance also influences the choice. If you’re comfortable with manager risk (the chance that a human makes the wrong stock picks or sector calls) and you want the potential upside that comes with active decision‑making, an active ETF can be part of your satellite allocation. If you prefer to eliminate manager risk and accept whatever the market gives you, passive is the safer fit.
Many investors use a blended approach: 60 to 80 percent passive core holdings for stability and low cost, and 20 to 40 percent active satellite positions for targeted opportunities or income strategies. That balance lets you control fees while still accessing active management where it has the best chance to add value.
Final Words
Use the quick checklist to compare costs, tracking error, turnover, liquidity, tax hits, and risk. It’s built to help you make a fast, practical decision when choosing between active and passive ETFs.
Match the result to your goals and timeline. If you want low-cost, broad exposure, lean passive; if you want a shot at outperformance and accept higher fees and turnover, consider active. Remember higher costs can reduce net returns.
If you want a simple next step, print the comparing active vs passive etfs evaluation checklist and score each ETF. Do one comparison today. Small steps add up.
FAQ
Q: What is the main difference between active and passive ETFs?
A: The main difference between active and passive ETFs is that passive ETFs track an index, while active ETFs use a manager who picks holdings and timing to try to beat a benchmark.
Q: What quick checklist should I use to compare active vs passive ETFs?
A: A quick checklist to compare active vs passive ETFs: expense ratio, tracking error, performance vs benchmark, turnover, tax efficiency, liquidity, bid-ask spread, concentration risk, manager track record, and strategy clarity.
Q: How do expense ratios and turnover affect ETF costs?
A: Expense ratios and turnover affect ETF costs by raising annual fees and trading costs; higher turnover often means more bid-ask spread and potential taxable events, making active ETFs usually more expensive than passive ones.
Q: What performance metrics matter beyond simple returns?
A: Performance metrics beyond returns include alpha (manager added value), Sharpe ratio (risk-adjusted return), beta (market sensitivity), downside deviation, and consistent outperformance versus the benchmark over time.
Q: How should I assess an ETF’s risk and portfolio impact?
A: Assess an ETF’s risk and portfolio impact by checking volatility, concentration of holdings, correlation with your other assets, and how a larger position would change your overall portfolio risk.
Q: How does turnover affect an ETF’s tax efficiency?
A: Turnover affects an ETF’s tax efficiency because frequent trading can create taxable capital gains; passive ETFs usually have lower turnover and therefore tend to be more tax-efficient for taxable accounts.
Q: What role do liquidity and tracking error play when trading ETFs?
A: Liquidity and tracking error matter when trading ETFs because tight liquidity lowers trading costs and small tracking error means the ETF closely follows its index, both reducing execution and performance risk.
Q: Which ETF type is usually better for long-term, low-cost investing?
A: For long-term, low-cost investing, passive ETFs are usually better because they offer broad index exposure, low expense ratios, and lower turnover, making them simple and tax-friendly for buy-and-hold investors.
Q: When might an investor prefer an active ETF over a passive one?
A: An investor might prefer an active ETF when seeking potential outperformance, niche exposure, or downside protection, and willing to accept higher fees and manager risk in exchange for those possibilities.
Q: What simple steps can I take today to compare two ETFs?
A: To compare two ETFs today, check expense ratio, tracking error, liquidity (average volume and spread), turnover, holdings overlap, past performance vs benchmark, and tax distributions for a quick side-by-side view.

