

Thinking you can live off dividends alone?
That idea sounds neat, but it needs a plan.
Dividend income funds—mutual funds and ETFs built to pay regular cash—can deliver monthly checks from high-yield stocks, bonds, REITs, and option income.
In this post I’ll show how those funds actually generate payouts, the main types and tradeoffs, and simple checks you can use to pick one that fits your bills and risk tolerance.
Read on to learn what works, what’s risky, and how to get steady cash without endless stock picking.
Core Explanation of Dividend Income Funds and How They Generate Cash Flow

Dividend income funds are pooled investment products (mutual funds or ETFs) that buy assets producing regular cash and hand it over to you on a schedule. The main point is current income, not waiting around for share prices to climb. If you need monthly or quarterly cash to cover bills, pad your retirement, or just add a reliable layer to your portfolio, that’s what these funds are built for.
Where does the money come from? Depends on the fund’s approach. Some buy dividend stocks. Others go for bonds paying interest, REITs kicking off rental income, or preferred stocks with fixed coupons. Plenty mix everything together to keep distributions steady and avoid leaning too hard on one thing.
The six income sources these funds typically use:
- Stock dividends from corporations (usually quarterly or monthly).
- Bond interest from corporate, government, or municipal bonds (monthly or twice a year).
- REIT distributions from rental income and property sales (often monthly).
- Preferred stock coupons that look like bond payments but trade like stocks.
- Covered call option premiums, where funds sell call options against their holdings for extra income.
- Special distributions when underlying holdings pay one-time dividends or capital gains.
Yields swing pretty wide. Dividend equity ETFs commonly sit around 2.0% to 4.5%. High-dividend or value ETFs often land between 3.5% and 6.0%. Preferred stock and high-yield bond funds typically pay 4.0% to 7.0%. Covered call and option income ETFs frequently deliver 6.0% to 10% or more. Most dividend equity and bond funds pay monthly, while traditional dividend equity ETFs usually pay quarterly.
Types of Dividend Income Funds and Their Different Income Strategies
High-Yield Equity Income Funds
These funds go after stocks with above-average yields, typically 3.5% to 6.0%. They often load up on utilities, energy, financials, and REITs because those sectors tend to pay fatter dividends. The catch is concentration risk. If oil tanks or rates spike, energy and utility dividends can get slashed, dragging down the fund’s payout and share price. In recessions, companies with stretched finances are first in line to cut. Higher yield doesn’t always mean safer income.
Dividend Growth Funds
Dividend growth funds bet on companies that have raised their dividend every year for at least 10 straight years. Yields run lower, maybe 2.0% to 3.0%, but the income usually grows over time. Think Dividend Aristocrats or Achievers indexes. The strategy relies on financial stability. Companies that can raise dividends through multiple recessions typically have solid cash flow and disciplined management. Downside? Lower starting yield means you’re waiting longer for compounding to build real income.
Monthly Distribution ETFs
Monthly funds are built to match cash flow with your bills. A lot of them use covered call strategies, selling call options on their holdings to generate extra premium income on top of dividends. Option income ETFs like JEPI and QYLD often yield 6.0% to 10% or more, paying monthly. Preferred stock ETFs also pay monthly and usually yield 4.5% to 6.5%. Advantage is predictable, frequent cash. Risk is that covered call strategies cap your upside when markets rally hard. Option premiums shrink when volatility drops. Preferred stocks move with interest rates, same as bonds.
Bond and Preferred Stock Income Funds
Bond income funds buy corporate, government, or municipal bonds and distribute the interest, usually monthly. Yields are stated as SEC yield, which reflects interest earned after fund expenses over the most recent 30 days. Short-term corporate bond funds might yield 3.0% to 4.5%. High-yield bond funds can pay 5.0% to 7.0% or more. Key risk is duration. If rates rise 1%, a bond fund with 5 years of duration will lose roughly 5% of its value. Preferred stock funds sit between bonds and stocks. They pay fixed coupons like bonds but trade on exchanges. Credit quality and rate sensitivity drive performance.
REIT and Multi-Asset Income Funds
REIT funds invest in real estate investment trusts, which are required by law to distribute at least 90% of their taxable income. REIT dividends usually get taxed as ordinary income, not qualified dividends. Yields typically run 3.0% to 5.5%. Multi-asset income funds blend stocks, bonds, REITs, sometimes preferreds to diversify income sources and smooth out volatility. These can offer moderate yields (4.0% to 6.0%) with lower risk than single-strategy funds, but they add complexity. Understanding the asset mix and how each piece reacts to rates, recessions, or inflation matters before you commit.
Key Metrics for Evaluating Dividend Income Funds

When you’re comparing dividend income funds, yield is part of the story. Two funds with identical yields can deliver very different results after fees, taxes, and distribution changes. Understanding how yield gets calculated and what drives the number keeps you from walking into traps.
Equity dividend funds often report a trailing 12-month (TTM) yield, which is total distributions paid over the past year divided by the current share price. Bond funds and some income ETFs report SEC yield, which reflects interest or income earned over the most recent 30 days, annualized and after expenses. SEC yield tends to be steadier and forward-looking. TTM yield can get inflated by special one-time distributions. Always compare both when you can.
Expenses matter more in income funds than growth funds because fees come directly out of what you receive. A fund with 4.5% gross yield and a 0.50% expense ratio nets you 4.0%. A similar fund with a 0.08% expense ratio nets 4.42%. Over 20 years, that 0.42% difference compounds to thousands on a mid-sized portfolio.
- SEC yield: the annualized income a bond or income fund expects to generate after expenses, based on the most recent 30 days.
- TTM yield: total distributions paid by an equity fund over the trailing 12 months, divided by current share price.
- Expense ratio: annual fee charged by the fund, expressed as percentage of assets, deducted from gross returns.
- Turnover rate: how frequently the fund buys and sells holdings. High turnover can trigger taxable capital gains.
- Distribution frequency: whether the fund pays monthly, quarterly, or semiannually. Affects cash flow planning.
| Metric | What It Measures | Why It Matters |
|---|---|---|
| SEC yield | Annualized income after expenses, based on recent 30 days | More reliable forward estimate for bond and income funds |
| TTM yield | Actual distributions paid over the past 12 months | Useful for equity funds but can be inflated by special dividends |
| Expense ratio | Annual fund fees as percentage of assets | Directly reduces net yield and long-term returns |
| Distribution frequency | How often the fund pays income (monthly, quarterly) | Affects cash flow timing and budgeting for living expenses |
When you’re screening funds, start with yield but immediately cross-check expense ratio and distribution history. A fund that cuts its distribution mid-year will show a high TTM yield early in the year, then disappoint when the payout drops. Look for funds with at least three years of stable or rising distributions and expense ratios below 0.30% for equity, below 0.15% for bond funds unless the strategy justifies higher fees.
Benefits and Risks of Dividend Income Funds for Income Seekers

Main benefit of dividend income funds is predictable, diversified cash flow without the work of picking and monitoring individual stocks or bonds. Instead of researching 30 companies and tracking their payout ratios, dividend cuts, and earnings reports, you buy one fund and receive regular distributions. For retirees or anyone living off portfolio income, that simplicity and consistency counts.
Compounding speeds up when you reinvest distributions during your working years. A dividend fund yielding 4.0% that also grows its distributions by 3% annually can double your income stream in roughly 24 years without adding new money. The combination of yield and dividend growth historically contributed about 85% of the S&P 500’s total returns since 1960 when dividends were reinvested.
Risks and traps to watch for:
- Yield traps: unusually high yields (above 10%) often signal the fund’s share price has fallen due to underlying problems, or distributions are unsustainable and funded by returning your own capital.
- High turnover: funds that trade frequently can generate short-term capital gains taxed at ordinary income rates, reducing your after-tax yield.
- Credit quality issues: high-yield bond funds and funds holding distressed preferreds can suffer large losses if issuers default or get downgraded.
- Duration risk: bond and preferred funds with long effective maturities can lose 5% to 10% or more when interest rates rise just 1%.
- Sector overexposure: many high-dividend equity funds load up on utilities, energy, and financials, leaving you exposed if one sector crashes.
- Capped upside in covered call strategies: option income ETFs sell call options on their holdings to generate premium income, which caps gains if the market rallies sharply. You collect extra yield but give up participation in big bull runs.
Tax Implications of Dividend Income Funds and What Investors Should Expect
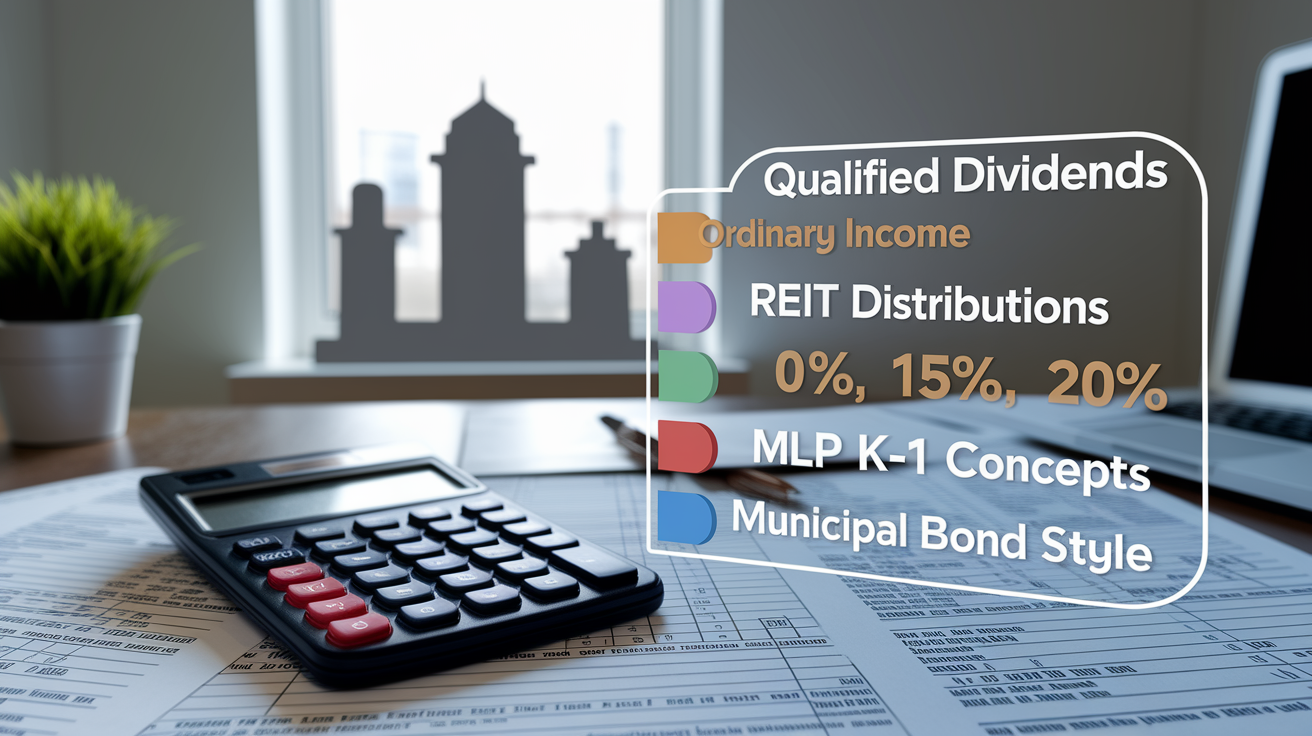
Not all dividend income gets taxed the same way. Qualified dividends from U.S. corporations and certain foreign companies get taxed at long-term capital gains rates: 0%, 15%, or 20% depending on your taxable income. To qualify, you must hold the underlying stock (or the fund must hold it) for more than 60 days during the 121-day period around the ex-dividend date. Most plain-vanilla dividend equity funds pay a high percentage of qualified dividends. Nonqualified dividends, bond interest, and option premiums get taxed as ordinary income at your marginal tax rate, which can hit 37% federally.
REIT distributions usually get taxed as ordinary income because REITs don’t pay corporate tax and pass through rental income and capital gains directly to shareholders. A portion of REIT distributions may be classified as return of capital, which reduces your cost basis and defers tax until you sell, but the rest is ordinary income. Master limited partnerships (MLPs) issue a K-1 tax form instead of a 1099, adding complexity at tax time. Municipal bond funds pay interest generally exempt from federal income tax, sometimes state tax if you live in the issuing state, making them attractive for high-income investors in taxable accounts.
Many income funds also distribute short or long-term capital gains at year-end when they sell holdings at a profit. Those capital gains are taxable in the year distributed, even if you reinvest them. For tax efficiency, hold dividend income funds that generate ordinary income or short-term gains inside IRAs, 401(k)s, or other tax-deferred accounts. Use taxable accounts for funds with high percentages of qualified dividends or tax-exempt municipal income. Check the fund’s tax-character breakdown in its annual report or on the provider’s website before deciding where to place it.
Top Examples of Dividend Income Funds With Yield and Cost Snapshots

Different income strategies deliver different yields, costs, and distribution schedules. Comparing a handful of popular funds side by side shows how equity dividend, bond, preferred, REIT, and option income approaches stack up. The table below reflects approximate yields and expense ratios as of a mid-2024 snapshot. Always verify current data on the fund provider’s website before investing, since yields and fees can shift with market conditions.
Equity dividend funds like SCHD and VYM offer moderate yields in the 3% to 4% range with very low fees. They focus on dividend quality and sustainability rather than chasing the highest possible yield. Covered call funds like JEPI and QYLD generate much higher yields by selling options, but those distributions include option premiums taxed as ordinary income and the strategy caps your upside. Bond funds like BND and AGG provide stable, monthly income with minimal equity risk but are sensitive to interest rate moves. Preferred and REIT funds fall in between, offering 4% to 6% yields with hybrid bond-stock characteristics.
| Fund | Yield | Expense Ratio | Distribution Frequency |
|---|---|---|---|
| SCHD (Schwab US Dividend Equity ETF) | ~3.4% | 0.06% | Quarterly |
| VYM (Vanguard High Dividend Yield ETF) | ~3.2% | 0.06% | Quarterly |
| SPHD (Invesco S&P 500 High Div Low Vol ETF) | ~4.5% | ~0.30% | Monthly |
| PFF (iShares U.S. Preferred Stock ETF) | ~5.5% | ~0.47% | Monthly |
| JEPI (JPMorgan Equity Premium Income ETF) | ~7.0% | ~0.35% | Monthly |
| QYLD (Global X NASDAQ 100 Covered Call ETF) | ~10%+ | ~0.60% | Monthly |
| BND (Vanguard Total Bond Market ETF) | ~3.0% | ~0.03% | Monthly |
| AGG (iShares Core U.S. Aggregate Bond ETF) | ~3.1% | ~0.03–0.04% | Monthly |
| VNQ (Vanguard Real Estate ETF) | ~3.5% | ~0.12% | Quarterly |
Notice the inverse relationship between yield and cost in some categories. Low-cost equity dividend funds (SCHD, VYM) deliver 3% to 4% with fees under 0.10%. Higher-yield strategies (JEPI, QYLD) charge 0.35% to 0.60% but include active management or option overlays. Bond funds offer the lowest expense ratios of all, often under 0.05%, because they track indexes and require minimal trading. When your goal is maximizing net income, every basis point of fees matters. A fund yielding 5.0% with a 0.50% expense ratio nets you 4.5%. A similar fund at 0.10% nets 4.9%. Over 20 years on a $100,000 position, that 0.40% difference costs you more than $8,000 in forgone income, assuming reinvestment at the same yield.
How to Choose Dividend Income Funds for Your Portfolio

Selecting the right dividend income fund starts with a clear target. If you need $2,000 per month and have $500,000 to invest, you need a portfolio yielding at least 4.8% after fees. If you’re 10 years from retirement and want growing income, a 3.0% yield today with 5% annual dividend growth may be better than a 6.0% yield that never rises. Match the fund’s yield, distribution frequency, and risk profile to your timeline and cash flow requirements.
Six steps to narrow your list and pick a fund that fits:
- Define your income target. Calculate how much monthly or quarterly cash you need and work backward to determine the required yield and portfolio size.
- Compare yields. Look at both SEC yield (for bond and income funds) and TTM yield (for equity funds). Favor funds where the two numbers are close, which signals stable distributions.
- Analyze fees. Target expense ratios below 0.30% for equity dividend funds, below 0.15% for bond funds, and below 0.50% for specialty strategies like covered calls. Every 0.10% in fees reduces your net yield by that amount.
- Check distribution history. Review the fund’s distribution per share over the past three to five years. Look for steady or rising payouts and avoid funds with erratic cuts or spikes.
- Review sector allocation. Check the fund’s top 10 holdings and sector weights. If more than 30% is in one sector (utilities, energy, financials), you have concentration risk.
- Confirm tax considerations. Determine whether distributions are qualified dividends, ordinary income, or tax-exempt interest, and place the fund in the most tax-efficient account type (IRA for ordinary income, taxable for qualified dividends or munis).
Once you have a shortlist of two or three funds, compare their performance during the last market downturn. A fund that maintained or grew its distribution in 2020 or 2022 is more likely to hold up in the next crisis than one that slashed payouts by 20%. Check assets under management and average daily trading volume. Funds with less than $300 million in AUM or daily volume under $5 million can have wide bid-ask spreads, costing you money on every trade.
Allocation Examples for Different Dividend Income Investors

Your allocation depends on how much risk you can handle, how much income you need today, and how long your money has to last. A retiree drawing 5% annually can’t afford a portfolio that drops 30% in a recession and cuts distributions. A 50-year-old building an income stream for 15 years from now can ride out volatility and prioritize dividend growth over current yield.
A conservative income portfolio targeting roughly 3.0% yield with low volatility might allocate 60% to a short or intermediate-term corporate bond ETF (duration under 4 years), 30% to a high-quality dividend equity ETF focused on Dividend Aristocrats or dividend growers, and 10% to a mix of REIT and preferred stock funds for diversification. This mix emphasizes stability and capital preservation. Monthly distributions from the bond and preferred portions provide steady cash flow, while the equity sleeve offers some inflation protection and potential dividend growth over time.
A moderate income portfolio targeting around 4.5% yield with balanced risk might hold 40% in dividend equity ETFs (split between high-yield and dividend-growth strategies), 30% in an aggregate bond ETF for stable income, 20% in a covered call or option income ETF to boost yield, and 10% in REITs and preferred stocks. This allocation accepts more equity volatility in exchange for higher current income and some upside participation. The covered call slice caps gains in bull markets but smooths distributions with option premiums.
An aggressive yield portfolio targeting 6.0% or higher might allocate 30% to high-yield corporate bond funds, 30% to covered call and option income ETFs, 30% to REIT funds and high-dividend equity ETFs, and 10% in cash or a money market reserve. This portfolio prioritizes income over capital preservation and accepts higher principal risk, sector concentration, and the possibility of distribution cuts during recessions. Best suited for investors with other income sources or a high risk tolerance who can handle 15% to 25% drawdowns without panic selling.
Due Diligence and Red Flags When Reviewing Dividend Income Funds

Not every high-yielding fund is a good deal. Some funds use accounting tricks, return of capital, or unsustainable payout policies to inflate distributions and attract yield-hungry investors. Others have hidden risks buried in the prospectus that only show up when markets turn. A quick checklist of red flags can save you from the worst traps.
Start by comparing the fund’s current yield to its historical average and to similar funds in the same category. If a preferred stock fund yields 8.0% and the category average is 5.5%, ask why. Maybe the fund holds lower-credit preferreds or uses leverage. Either way, that extra 2.5% yield comes with extra risk. Check the fund’s SEC filings and fact sheet for leverage ratios, credit quality breakdowns, and concentration in a single issuer or sector. A fund with 15% of assets in one company or 40% in one industry is taking a concentrated bet, not offering true diversification.
Five major red flags that should make you pause or walk away:
- Excessively high yield (above 10% for equity or hybrid funds): often signals the fund is returning your own capital, using leverage, or holding distressed assets that could default.
- Low assets under management (below $100 million): small funds have higher closure risk, wider bid-ask spreads, and less liquidity. You may struggle to exit at a fair price.
- Opaque or complex strategies: if the prospectus doesn’t clearly explain how income gets generated (covered calls, synthetic dividends, derivatives), assume there are risks you don’t understand.
- Extreme sector concentration: more than 40% in one sector (energy, utilities, REITs) leaves you exposed to industry-specific shocks like regulatory changes or commodity price crashes.
- Poor distribution stability: funds that cut distributions by more than 10% in any of the past three years, or that show erratic month-to-month payouts, lack reliable income sources.
Final Words
You saw how dividend income funds create cash flow, the main fund types, the key metrics to check (SEC vs TTM yield, fees, turnover), tax basics, sample funds, and simple allocation ideas.
Next, pick a realistic income target, compare yields and fees, check distribution history, and choose the right account for tax treatment. A short, 30-minute review will get you moving.
With a steady plan and regular contributions, dividend income funds can help supply reliable cash while you keep building toward your goals. You got this.
FAQ
Q: What is the best dividend income fund?
A: The best dividend income fund depends on your goals, timeline, and risk tolerance. For many, a low-cost broad dividend ETF (like SCHD or VYM) offers steady yield, low fees, and liquidity.
Q: How do I make $1000 a month in dividends?
A: To make $1,000 a month in dividends, estimate required capital by dividing $12,000 annual goal by your target yield, then build a diversified mix of dividend ETFs, bonds, and covered-call funds, and add monthly contributions.
Q: What is a dividend income fund?
A: A dividend income fund is a pooled investment that buys dividend-paying stocks, bonds, REITs, or option-income strategies to provide regular cash distributions, aiming for steady income rather than mainly capital growth.
Q: Are dividend funds a good investment?
A: Dividend funds can be a good investment if you want steady cash, but they carry risks like dividend cuts, sector concentration, and interest-rate sensitivity—match fund type and yield to your timeline and risk tolerance.

