

Chasing the highest yield can burn your returns, and it’s a surprise most investors don’t expect.
Fidelity runs several dividend funds with different goals: some pay a big payout today, others focus on companies that grow dividends year after year.
This post cuts through the main numbers: performance, SEC and trailing yields, fees, and risk, so you can see which fund fits your need: cash now or a growing income stream later.
You’ll leave with simple steps to compare tickers, share classes, and payout schedules.
Key Facts About Fidelity’s Dividend Fund Options
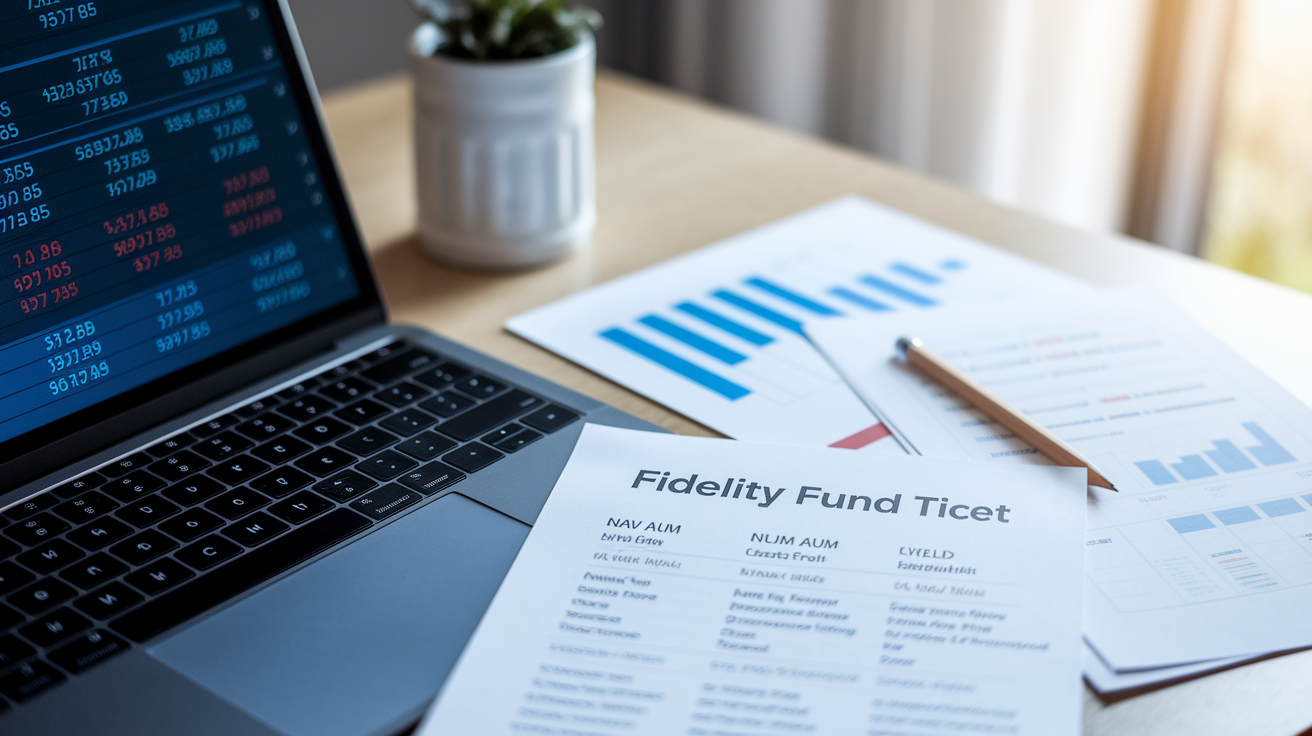
Fidelity runs several dividend funds built to throw off regular income while still giving you room to grow. They come in different share classes (Investor, Admiral, ETF) with different price tags and fee levels. Some chase dividend growth, picking companies that keep bumping their payouts year after year. Others go for high yield right now, grabbing stocks with fat distributions today. Which Fidelity dividend fund makes sense depends on what you want: cash in hand now, or a growing stream down the road.
Every fund gets a ticker symbol you’ll use to track the price and buy shares. NAV is the price per share at market close, and it shifts daily. The fund also shows assets under management (AUM), the total pile of money from all investors. Expense ratio is your annual fee, shown as a percentage (say, 0.45 percent). Yield numbers like SEC yield and trailing 12-month yield tell you how much income the fund just delivered, usually refreshed monthly or quarterly.
When you’re digging into any Fidelity dividend fund, grab these numbers first:
- Ticker and share class so you know exactly which version you’re buying.
- NAV and as-of date for the latest price per share.
- Expense ratio because lower fees mean more money stays in your account to compound.
- SEC yield and trailing 12-month yield to see forward income estimates and what actually got paid.
- Distribution frequency and last pay date so you know if dividends land monthly, quarterly, or yearly, plus when the last one hit.
- Minimum initial investment to see how much cash you need to open the account.
Dividend Strategy Behind Fidelity’s Dividend-Focused Funds

Fidelity’s dividend funds hunt for companies pumping out strong free cash flow, keeping payout ratios in check, and posting reliable earnings growth. Payout ratio shows how much of a company’s profit goes straight to dividends. If it’s too high, the business won’t have enough left over to reinvest or survive a rough patch. Fund managers look for ratios under 70 or 80 percent, leaving breathing room for safety and future raises.
Earnings coverage and free cash flow matter because dividends come from actual cash, not just accounting tricks. A company can show earnings on paper but still lack the cash to pay you if it’s burning money on expansion. Fidelity’s managers want businesses generating more cash than they spend, then sharing a smart chunk with shareholders. The playbook leans on stability instead of chasing the absolute highest yields you can find today.
The selection usually includes:
- Companies that raise dividends every year (dividend growers).
- Businesses carrying low debt and pulling in predictable revenue (defensive quality).
- Stocks priced fairly compared to their dividend growth runway.
- Sector spread to avoid putting all your eggs in one industry basket.
Performance Expectations for a Fidelity Dividend Fund

Performance for dividend funds wraps up both price moves (capital appreciation) and the cash that hits your account. Total return smashes the two together. When sizing up any Fidelity dividend fund, check year-to-date (YTD), 1-year, 3-year, 5-year, and 10-year annualized returns. Longer windows iron out short-term noise and show how the fund handled different market moods. Since-inception returns give you the whole story from day one.
Drawdown tells you how far the fund dropped during its ugliest stretch, and recovery time shows how long it took to climb back. Dividend funds usually don’t crater as hard as growth funds in bear markets, but they can trail when the bulls are running. Risk-adjusted metrics like the Sharpe ratio stack returns against volatility, helping you see if you got paid enough for the bumps.
| Period | What Investors Should Look For |
|---|---|
| 1 year | Short-term score and how the fund just reacted to markets. Did it beat or lag its benchmark? |
| 3 and 5 years | Medium-term steadiness. Does the fund deliver across different economic weather? |
| 10 years and since inception | Long haul track record. Shows manager chops, strategy staying power, and compounding through full cycles. |
Understanding Fidelity Dividend Fund Yields & Payouts

Dividend yield is annual income (all the distributions over 12 months) divided by the current share price, shown as a percentage. A fund sitting at $20 NAV that paid $1 over the year delivers a 5 percent yield. SEC yield looks forward, giving you a standardized estimate so you can compare funds cleanly. Trailing 12-month yield looks backward, adding up what actually got paid. Both numbers bounce around when share prices shift or when the portfolio companies tweak their dividends.
Distribution frequency tells you how often cash lands in your account. Most Fidelity dividend funds pay quarterly. A few go monthly. Each payout runs through a cycle: the ex-dividend date (cutoff to get the next payment), the record date (when the fund checks who owns shares), and the payable date (when cash shows up). Buy shares after the ex-dividend date and you miss that round, waiting for the next one.
Dividend reinvestment plans (DRIPs) automatically flip your cash back into more shares at NAV, usually with no transaction fee. Reinvesting compounds your stake without you lifting a finger.
The typical cycle looks like this:
- Ex-dividend date: own shares by market close the day before to qualify.
- Record date: fund logs everyone eligible for payment.
- Payable date: cash or reinvested shares hit your account.
- Reinvestment (optional): your brokerage or the fund buys fractional shares if you turned on DRIP.
- Qualified dividend status: IRS label that might cut your tax rate on the income (depends on holding period and fund makeup).
Fees, Expenses & Minimum Investments for Fidelity Dividend Funds
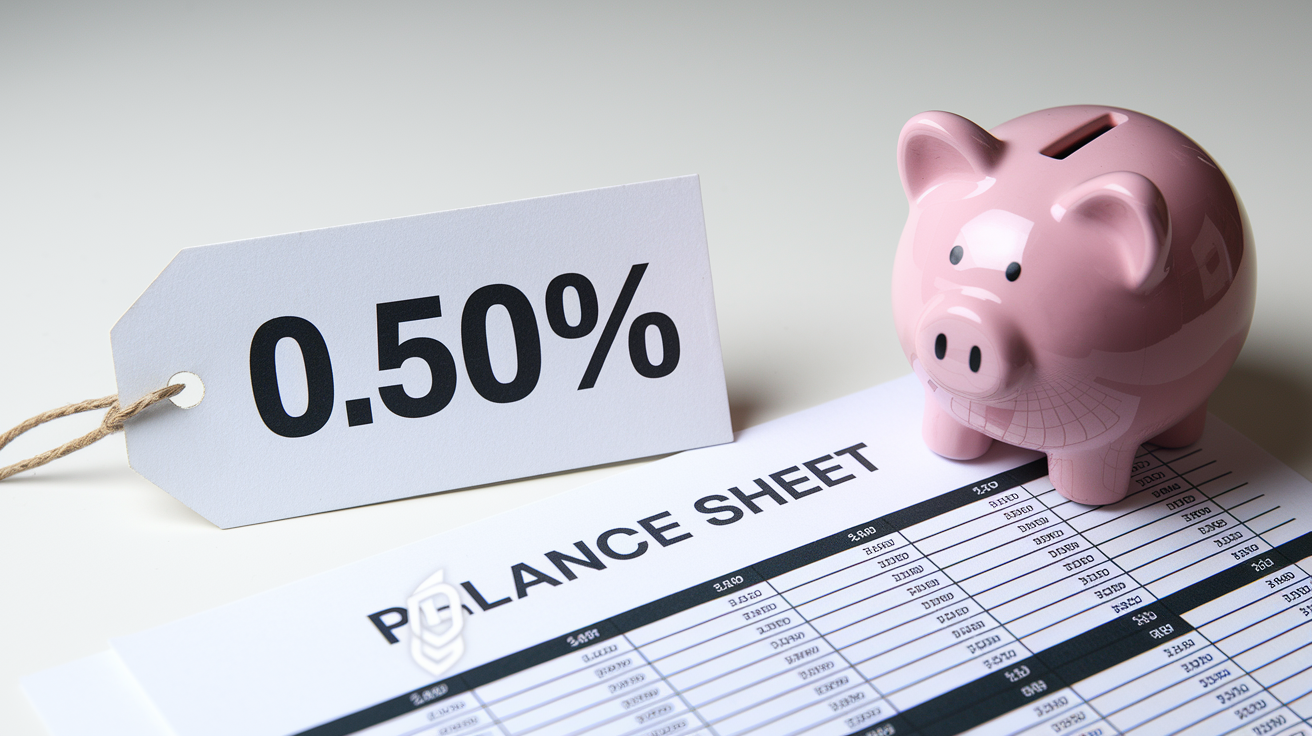
Expense ratio is the yearly cost of holding the fund, sliced off daily from the fund’s assets and baked into the NAV. A 0.50 percent ratio on $10,000 means $50 a year. Lower fees leave more cash working for you. Fidelity offers multiple share classes, each with its own expense ratio and entry price. Investor class shares usually cost more in fees but ask for less money upfront. Admiral or institutional shares charge less but want bigger initial stakes, often $50,000 or $100,000.
No-load funds skip the sales charge when you buy or sell. Load funds hit you with a commission, either upfront (front-end load) or on the way out (back-end load). Most Fidelity dividend funds are no-load. Some share classes tack on 12b-1 fees, small annual charges covering marketing and distribution. Transaction costs like short-term redemption fees kick in if you bail within a set window, discouraging fast flips that mess with the portfolio.
| Fee Type | What It Covers |
|---|---|
| Expense ratio | Management, admin, recordkeeping, operations. Charged annually as a slice of your assets. |
| 12b-1 fee (if applicable) | Marketing and distribution. Bundled into the expense ratio and capped by regulation. |
Portfolio Breakdown: Holdings & Sector Exposure in Fidelity Dividend Funds

A typical Fidelity dividend fund holds anywhere from 50 to 150 stocks, mixing focus with spread. The top 10 holdings usually grab 20 to 40 percent of total assets, so the biggest bets matter but the fund isn’t riding on one company. Sector tilt leans toward financials, consumer staples, health care, and utilities because those corners of the market crank out steady cash and reliable dividends.
Turnover percentage shows how much of the portfolio got swapped in the past year. Thirty percent turnover means the fund sold and bought roughly a third of its positions. Lower turnover keeps trading costs and taxable gains in check. Fidelity dividend funds typically run moderate turnover, updating when dividend safety or price changes but skipping hyperactive churn.
What you’ll usually see in the holdings:
- Blue-chip stocks with long dividend records and solid balance sheets.
- Dividend aristocrats (25+ years of raises) or dividend achievers (10+ years).
- Sector spread across financials, consumer staples, industrials, health care, utilities to spread the risk.
- Light on high-growth tech that pays little or nothing, keeping the focus on income.
- Some REITs or MLPs in certain funds to juice yield, though taxes work differently.
- Position sizes that balance conviction (meaningful stakes in top picks) with risk control (no single stock over 5 to 7 percent).
Risk Profile & Management of a Fidelity Dividend Fund
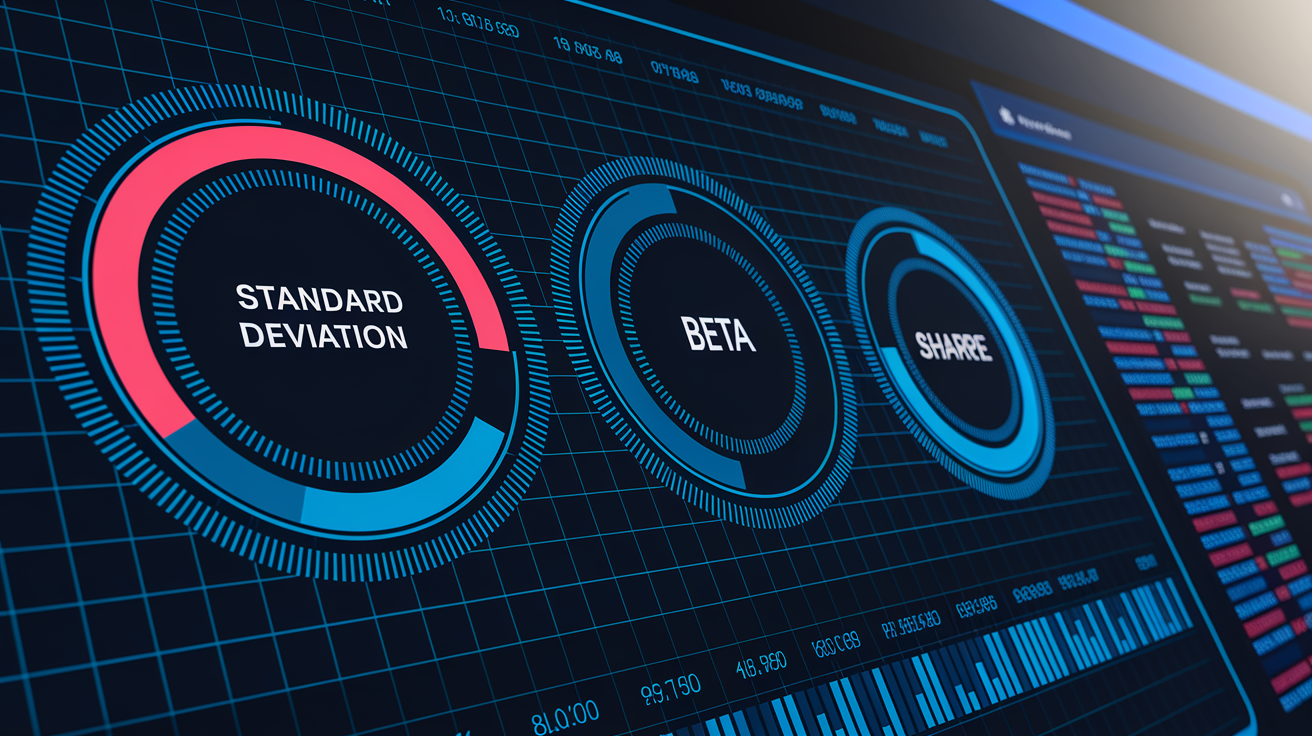
Risk metrics show you how bumpy the ride gets and how the fund moves with the broader market. Standard deviation measures price swings (how much the fund’s returns bounced around its average over 1, 3, or 5 years). A 12 percent standard deviation means annual returns typically landed within 12 points above or below average about two-thirds of the time. Lower standard deviation means smoother sailing.
Beta compares how sensitive the fund is to market moves. Beta of 1.0 means it tracks the benchmark. Beta under 1.0 suggests less volatility (common for dividend funds holding defensive stocks). Sharpe ratio divides extra return (return above the risk-free rate) by standard deviation, showing bang for buck on risk. Higher Sharpe means better payoff for the swings you endured. Morningstar and others slap category risk ratings (low, below average, average, above average, high) by stacking the fund against peers.
Core risk signals to grab:
- Standard deviation for day-to-day and month-to-month swings.
- Beta to see market linkage. Lower beta funds drop less in crashes but may lag rallies.
- Sharpe ratio to judge if returns justified the volatility.
- Manager tenure because longer runs often mean consistency. Frequent manager turnover can shake up strategy.
Tax Considerations for Fidelity Dividend Funds

Dividends get taxed as either ordinary income or qualified dividends. Qualified dividends face lower federal rates (0, 15, or 20 percent depending on your bracket) if you held the stocks long enough and they pass IRS tests. Most dividend funds report a qualified percentage each year, showing what slice qualified for the break. Non-qualified dividends get hit at your regular income rate.
Capital gains distributions happen when the fund sells winners and passes the profit to you. Even if you reinvest, you owe tax on the payout in a taxable account. Turnover drives how often gains get realized. Lower turnover usually cuts down taxable events. In tax-sheltered accounts (traditional IRA, Roth IRA, 401k), dividends and gains grow tax-deferred or tax-free, so you skip annual tax bills. Roth accounts deliver tax-free withdrawals in retirement, making them sweet for dividend funds that spin off steady taxable income in regular brokerage spots.
How Fidelity Dividend Funds Fit Into a Long-Term Portfolio

Dividend funds work for investors wanting regular cash without selling shares. Retirees often park a chunk in dividend funds to cover bills, dodging the need to dump holdings during downturns. Even younger investors use them for diversification and to smooth volatility, since dividend payers tend to be mature, profitable companies less tied to economic mood swings.
Balanced portfolios might hold 20 to 40 percent in dividend funds, with the rest spread across growth stocks, bonds, or international. Rebalancing once or twice a year keeps your target mix on track. If your dividend fund outperforms and swells to 50 percent, you trim some and buy what lagged. Systematic withdrawal plans let you set up automatic monthly transfers to your bank, creating predictable cash flow.
Where dividend funds add value:
- Retirement income to provide steady payouts alongside Social Security or pension.
- Volatility cushion because defensive dividend stocks often fall less in bear markets.
- Inflation buffer (partial) since dividend growers lift payouts over time, helping income chase rising costs.
- Tax-smart income in Roth accounts where qualified dividends grow tax-free and withdrawals don’t get taxed.
- Diversification from growth by adding exposure to value-tilted, cash-spitting businesses that zig when high-growth tech zags.
Comparing Fidelity Dividend Funds to Competitors

Fidelity goes head to head with Vanguard, Schwab, and others in the dividend game. Vanguard rolls out low-cost index dividend funds that track benchmarks with minimal hands-on management. Schwab runs both active and passive dividend picks with competitive fees. Smaller shops and ETF providers launch dividend plays too, some chasing high yield, others targeting growth or quality.
When stacking them up, check expense ratio (lower fees compound faster over decades), yield focus (income now versus growth later), historical returns over 3 and 5 years, and AUM (bigger funds signal popularity and liquidity). Passive index options typically charge rock-bottom fees but hand you market-average results in the dividend bucket. Active Fidelity funds swing for outperformance through stock picks, sector bets, and timing, though results vary by manager and market mood.
| Fund | Expense Ratio | Yield Focus | Return Snapshot |
|---|---|---|---|
| Fidelity Dividend Growth (example) | Mid-range active fee | Dividend growth and quality | Shoots for above-benchmark returns through active picks and stock selection. |
| Vanguard Dividend Appreciation Index | Low index fee | Dividend growth | Tracks an index of dividend growers. Delivers market-like results with tiny cost. |
| Schwab U.S. Dividend Equity ETF | Very low ETF fee | High current yield | Grabs top 100 highest-yielding U.S. stocks. More income but more sensitive to interest rates. |
Final Words
If you’re deciding whether a fidelity dividend fund fits your plan, here’s the quick take.
We walked through the fund types and key stats, the dividend selection rules, yield and payout details, fees and tax points, typical holdings and risk signals, and how to compare Fidelity to peers. You should now know what to check before you buy.
A fidelity dividend fund can add steady income and some stability, but it’s not risk-free—check fees, yield history, and your taxes. Start small, set a regular contribution, and you’ll build confidence over time.
FAQ
Q: What is the highest paying dividend fund?
A: The highest paying dividend fund is not fixed; yields change daily and across funds. Rather than chase the top yield, compare trailing yields, expense ratios, payout sustainability, and underlying risk before investing.
Q: How much to invest to make $1000 a month in dividends?
A: To make $1,000 a month in dividends you need about $240,000 to $600,000 depending on yield. Divide $12,000 annual income by your fund’s yield (as a decimal) to estimate the exact principal.
Q: Do any Fidelity funds pay monthly dividends?
A: Some Fidelity funds do pay monthly dividends, mainly certain income or bond funds. Check the fund’s distribution schedule and yield, since monthly payouts don’t guarantee higher annual income or payout stability.
Q: Is Fidelity Dividend Growth Fund good?
A: The Fidelity Dividend Growth Fund can be a good choice if you want rising income and a mix of quality dividend growers. Assess its fees, past returns, yield, and fit with your goals before deciding.

