

Think a low expense ratio means a cheap ETF? Think again.
The number on the fund sheet is real, it gets taken out daily, but it’s only the start.
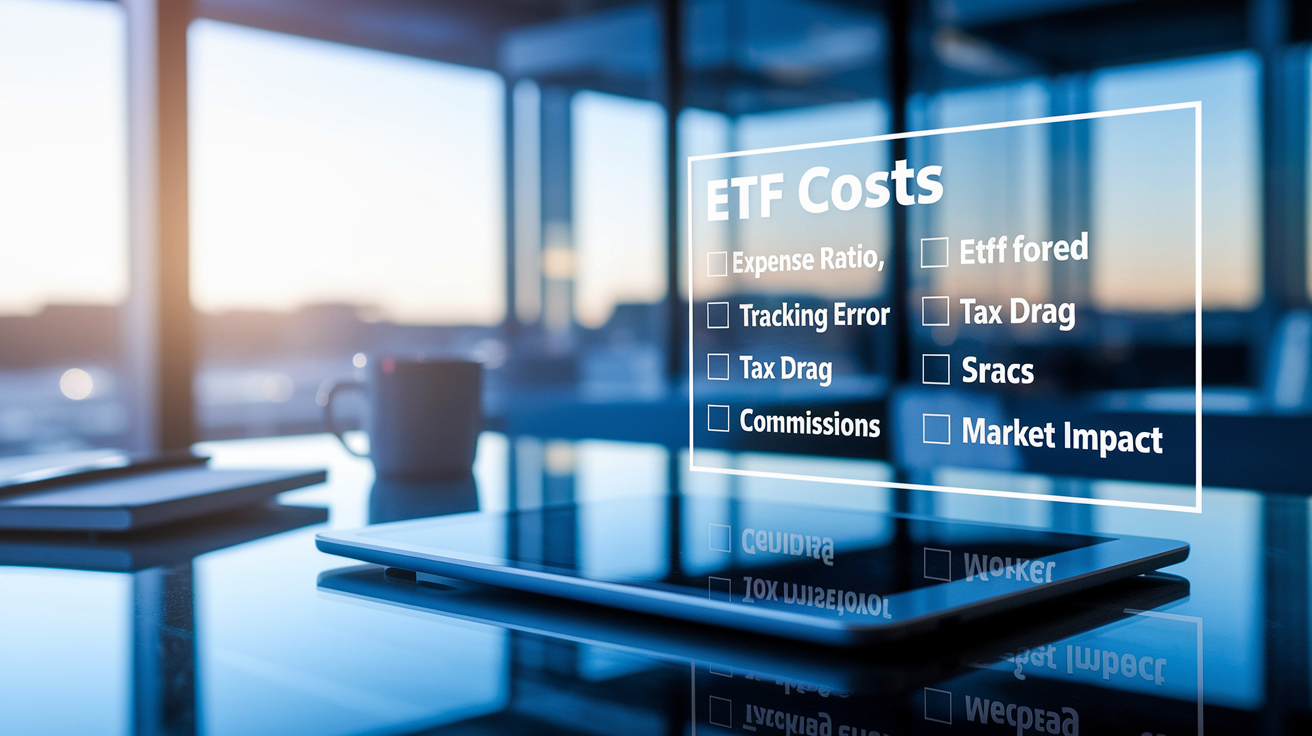
Bid-ask spreads, brokerage fees, tracking error, tax distributions, fee waivers and premiums or discounts can add hidden costs that make two similar funds very different for your portfolio.
This piece gives a simple checklist and quick steps to measure the ETF’s total cost of ownership so you keep more of your returns.
Core Principles for Evaluating ETF Costs Beyond the Expense Ratio
The expense ratio shows how much a fund charges each year to manage your money. Usually it’s something like 0.10 percent or 0.50 percent. Those operating expenses cover portfolio manager salaries, paperwork, basic overhead. The ratio gets deducted from your returns a little bit every day, so you don’t write a check, but it quietly chips away at your balance over time.
Staring at that published fee misses what really happens. Two ETFs tracking the same index can list nearly identical expense ratios, yet one ends up costing you noticeably more once you buy and sell shares. Real trading adds friction. Taxes appear when funds distribute gains. And the fund itself might not track its index perfectly. All those extras stack on top of the headline number.
Total cost of ownership wraps everything you pay to own an ETF over a period. Holding costs include the expense ratio, tracking error when the fund drifts from its benchmark, tax drag from capital gains distributions. Trading costs include the spreads you cross entering or exiting, any commissions your broker charges, market impact when you move a large position. When researchers looked at the 100 largest US equity ETFs, they found no relationship between a fund’s expense ratio and its average bid‑ask spread. So a low fee doesn’t automatically mean low trading costs.
Before choosing an ETF, review these six pieces:
- Stated expense ratio, both gross and net if fee waivers apply
- Typical bid‑ask spread and how it shifts during normal and stressed markets
- Brokerage commissions or platform fees for buying and selling shares
- Historical tracking error compared to the fund’s benchmark
- Tax efficiency, measured by past capital gains distributions
- Market impact and slippage if you plan to trade large positions or rebalance often
How to Locate and Interpret an ETF’s Expense Ratio in Official Fund Documents
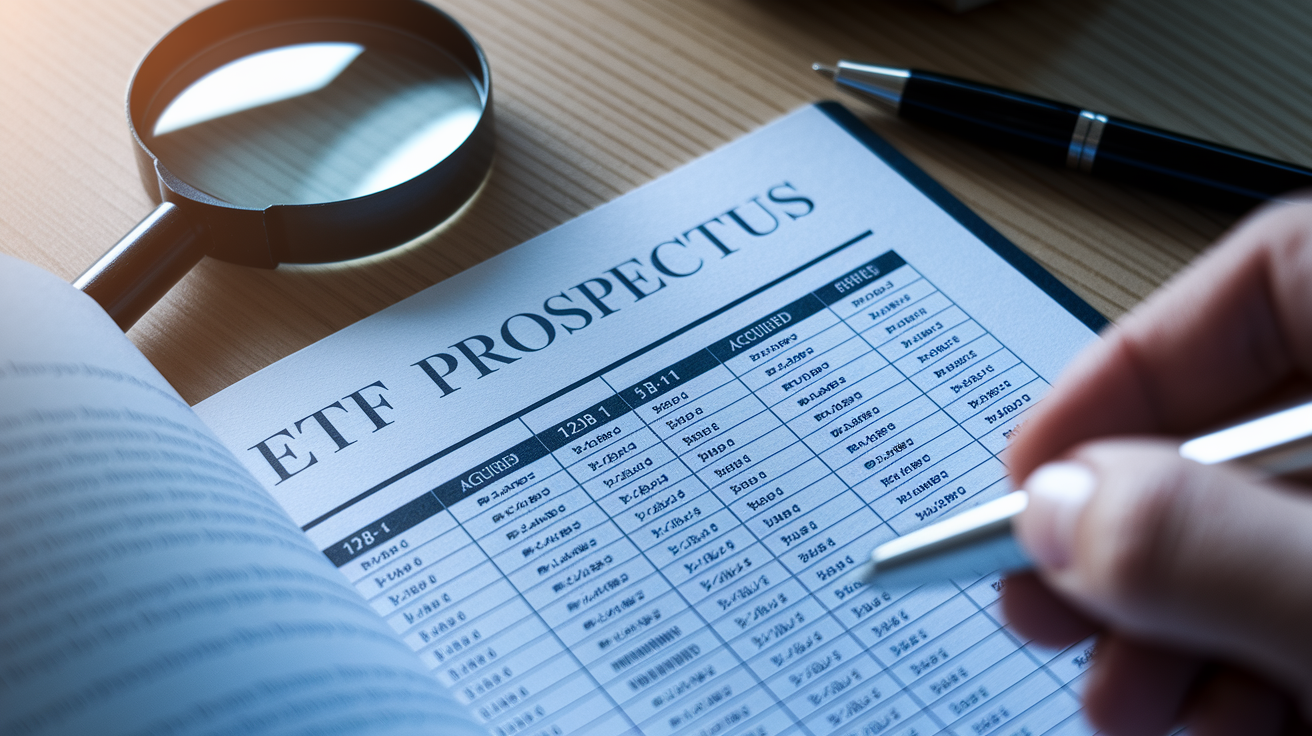
Every ETF publishes a prospectus with a fee table near the front. That table breaks out the expense ratio using a simple formula: total annual operating costs divided by total assets. The number appears as a percentage, often with an equivalent in basis points where one basis point equals 0.01 percent. So 0.25 percent is the same as 25 basis points. The fund accrues that cost every trading day and reduces the net asset value by a fraction, which means your returns shrink automatically without any transaction hitting your account.
Some prospectuses show both a gross expense ratio and a net expense ratio. Gross includes all fees before waivers. Net reflects temporary fee waivers the fund company agreed to cap. Waivers can expire on a set date or end once assets reach a threshold, so the net ratio you see today might jump back to the gross level later. Always check the footnotes in the fee table for waiver terms. Look at the fund’s annual report to see whether operating expenses crept higher during the past year.
| Fee Component | Description |
|---|---|
| Management fee | Payment to the portfolio managers and investment team for research, trading decisions, and day‑to‑day operations |
| Marketing and distribution | Covers advertising, sales materials, and distribution expenses to brokers or platforms (12b‑1 fees in mutual funds) |
| Administrative and recordkeeping | Costs for accounting, recordkeeping, compliance filings, legal work, and custody of the fund’s securities |
| Acquired fund fees | When an ETF holds other funds, those underlying fees pass through and add to the total (common in fund‑of‑funds) |
| Other operating expenses | Miscellaneous costs such as board fees, audit fees, and technology systems, often grouped together in the table |
Comparing Expense Ratios Across ETF Categories for Meaningful Cost Benchmarking
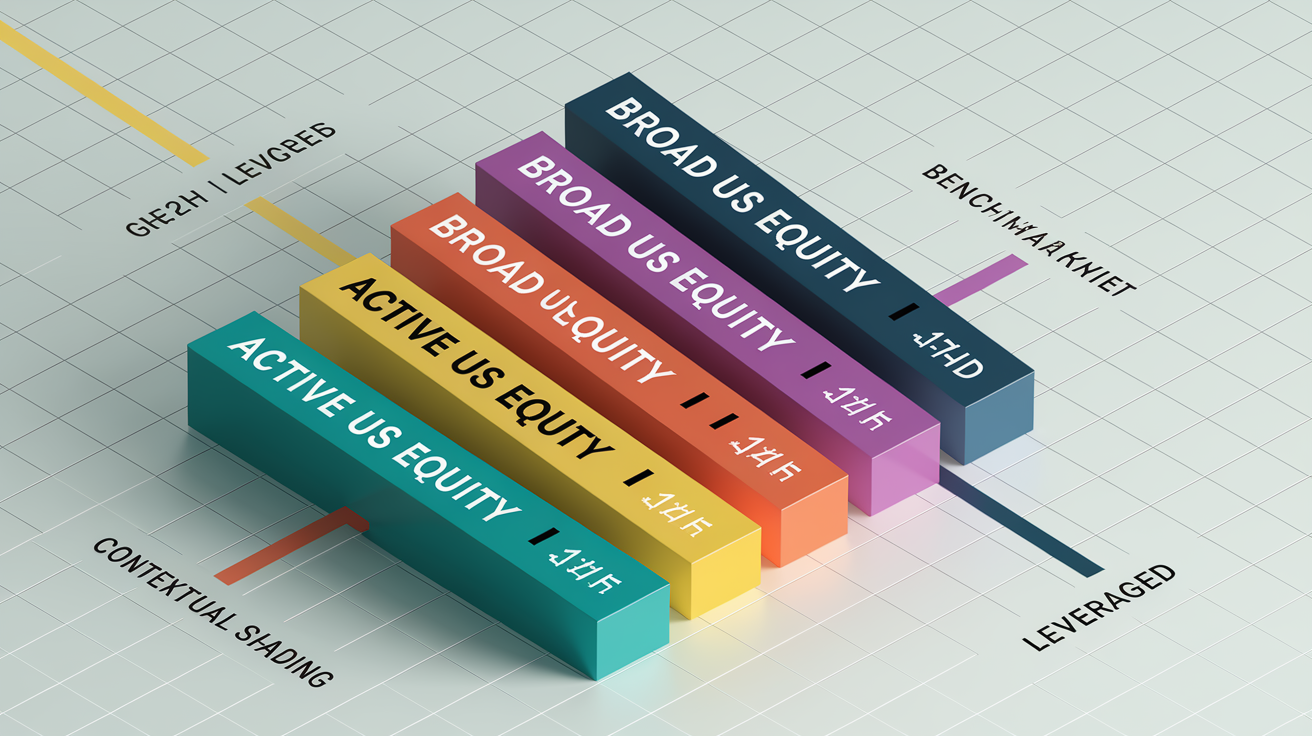
A 0.50 percent expense ratio sounds high if you’re comparing broad US stock index ETFs, where many charge well below 0.10 percent. That same 0.50 percent might be typical or even low for an actively managed international small‑cap fund. Context matters because different strategies require different levels of effort, research, and trading activity. An ETF that simply buys and holds every stock in the S&P 500 runs on autopilot. A fund picking individual bonds in emerging markets pays analysts and racks up higher transaction costs.
Benchmarks give you a starting point. For plain equity index ETFs covering large US companies, anything at or below 0.25 percent lands in low‑cost territory. Bond ETFs that track investment‑grade indexes typically come in under 0.20 percent. Mutual funds cost more on average, with passively managed equity funds around 0.50 percent or less and bond funds around 0.40 percent, though ETFs usually undercut those figures. Active equity ETFs often sit between 0.50 percent and 1.00 percent. Specialized categories push higher.
When you scan fund screeners or compare options, group candidates by objective and structure. An apples‑to‑apples look means lining up two S&P 500 trackers or two emerging‑market bond funds, not mixing a passive total‑market ETF against a leveraged sector bet. Funds that use leverage, derivatives, or complex strategies to amplify returns or inverse exposure routinely charge several times what plain index products do.
Here are rough expense‑ratio ranges for common ETF types:
- Broad US equity index, 0.03 to 0.10 percent
- Active US equity, 0.50 to 1.00 percent or higher
- Bond index, 0.05 to 0.20 percent
- Leveraged, inverse, crypto, BDC‑focused, or fund‑of‑funds, 0.75 percent and up, sometimes exceeding 10 percent
Identifying Hidden ETF Costs: Trading Friction, Liquidity, and Market Pricing Effects
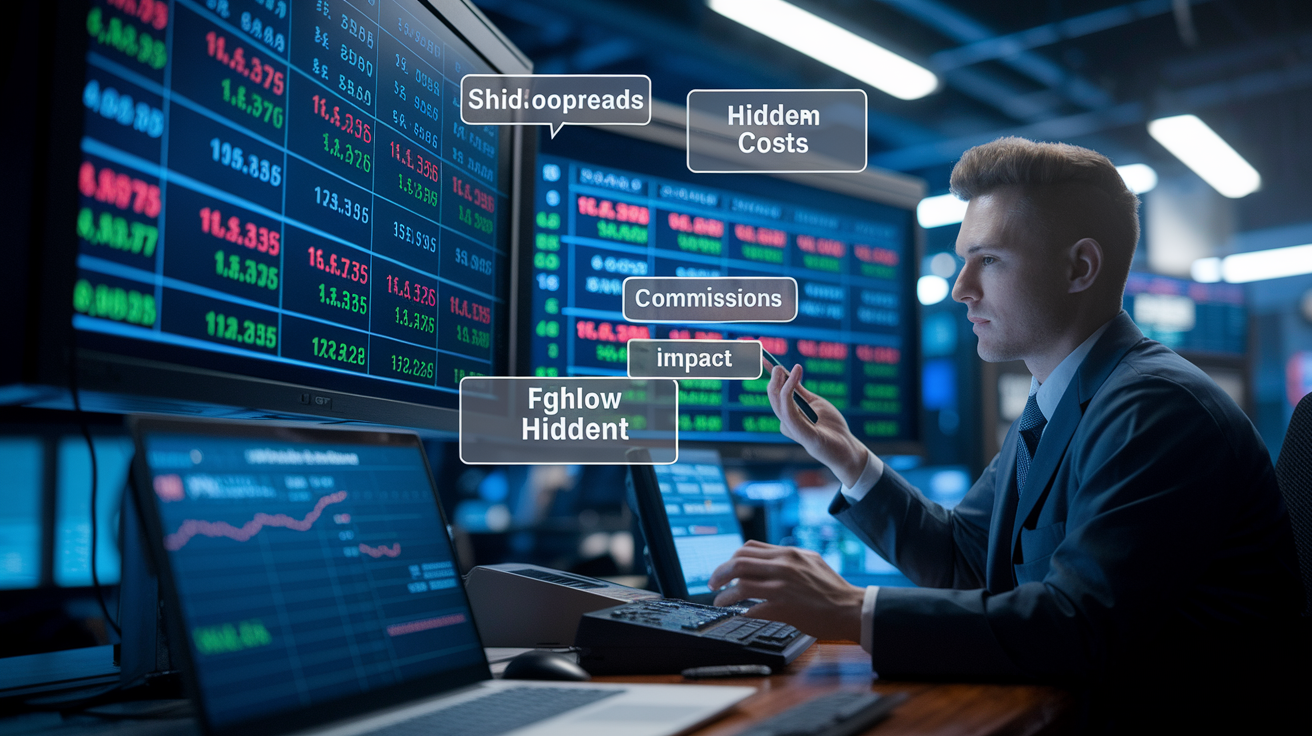
The expense ratio deducts from your returns steadily over the year. But every time you trade shares you pay a second set of costs at the point of entry and exit. Brokerage commissions used to run five to ten dollars per trade across the board. Many platforms now charge zero for online equity and ETF orders. Some brokers still tack on fees for phone orders, broker‑assisted trades, or certain fund families, and those can range up to twenty‑five dollars or more per transaction. On a five‑hundred‑dollar purchase, a five‑dollar commission eats 1.0 percent of your money before you even own the shares. Scale that trade up to five thousand dollars and the same five dollars becomes 0.1 percent.
Bid‑ask spreads represent the gap between the highest price a buyer will pay right now and the lowest price a seller will accept. When you buy at market, you pay the ask, the higher number. When you sell at market, you receive the bid. That round trip costs you the full width of the spread. Market makers set those quotes based on how easy it is to trade the ETF’s underlying holdings, how much inventory risk they take, and how much competition exists among liquidity providers. A fund holding big, liquid US stocks like Apple and Microsoft typically shows a spread of a few cents, maybe one or two basis points of the share price. A fund holding thinly traded emerging‑market bonds or obscure small‑cap stocks can have spreads ten or twenty times wider.
Market impact shows up when your order is large enough to move the price. If you try to buy ten million dollars of a niche ETF in a single block, you might push the ask higher as market makers adjust to the sudden demand. Selling a big position can drive the bid down. Impact depends on the fund’s average daily trading volume and the liquidity of its holdings. For retail investors trading a few thousand dollars at a time, impact is usually negligible. Anyone rebalancing a large portfolio or making tactical shifts should factor it in.
ETFs can trade at prices slightly above or below the value of their underlying holdings. That difference is the premium when the market price exceeds the net asset value, or the discount when the price sits below NAV. Most broad US equity ETFs trade within 0.20 percent of their calculated value throughout the day, thanks to the creation and redemption mechanism that lets big investors swap baskets of stock for ETF shares and vice versa. Less liquid markets, high‑yield bonds, commodities, or international funds in different time zones can show premiums or discounts of one percent or more. If you buy at a 0.6 percent premium and later sell at a 0.4 percent discount, you gave up a full percentage point that never shows up in any fee table.
Using Liquidity Metrics to Assess Real ETF Trading Costs
Average daily trading volume gives you a first read on how easy it is to get in and out of an ETF without moving the price. Funds that trade millions of shares every day usually have tight spreads and plenty of competition among market makers. When volume dries up, spreads widen because fewer participants want to take the other side of your trade. Researchers consistently find a strong link between higher volume and lower bid‑ask spreads, even though there’s no similar link between volume and expense ratios. That means liquidity matters more for your trading bill than the fund’s annual fee does.
Thirty‑day average bid‑ask spread data appears on many fund research sites and broker platforms. You want the percentage spread, not just the dollar amount, because a five‑cent spread on a ten‑dollar share is much wider in percentage terms than five cents on a hundred‑dollar share. Compare that figure across similar ETFs and watch how it behaves during market stress. Spreads can blow out during volatility, as happened during the COVID‑19 selloff and regional banking turmoil. If a fund’s spread normally sits at 0.05 percent but jumps to 0.50 percent when markets wobble, that volatility in trading cost is a real risk for anyone who might need to exit in a hurry.
Four practical liquidity indicators you can check before buying:
- Average daily volume over the past month. Higher is generally better and reduces the chance your order will move the market.
- Median bid‑ask spread as a percentage, not just the dollar width, which lets you compare funds with different share prices.
- On‑exchange trading volume versus creation and redemption activity. Funds with heavy creation‑redemption flows often have good underlying liquidity even if exchange volume looks modest.
- Number and identity of authorized participants. More APs usually mean better arbitrage and tighter alignment between market price and NAV.
Quantifying Total Cost of Ownership With Real‑World Examples
Total cost of ownership adds up everything you pay over the time you hold the fund. Start with the annual expense ratio multiplied by your average account balance, then layer on the entry cost when you buy, the exit cost when you sell, and any rebalancing trades in between. Tax drag from capital gains distributions and tracking error, the fund’s under‑ or over‑performance versus its stated benchmark, round out the picture. A simple scenario helps show how these pieces fit together.
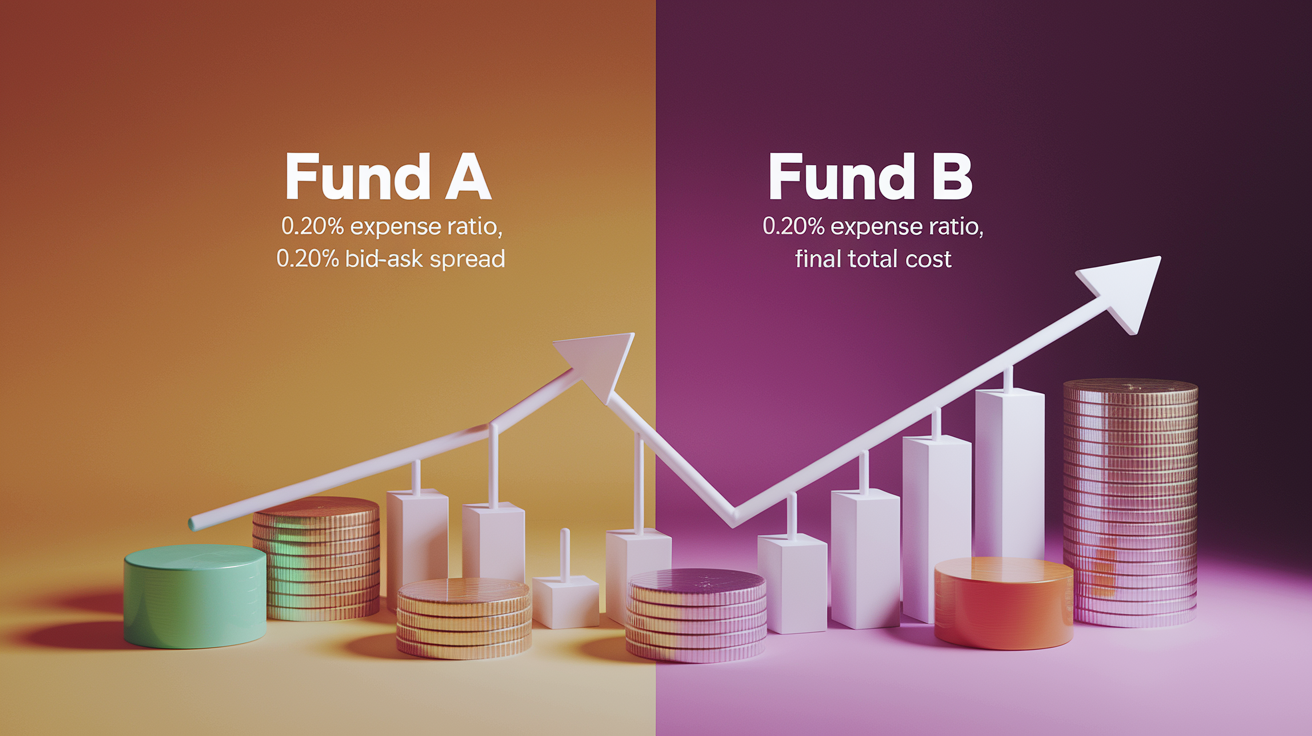
Imagine you invest ten million dollars in two similar index ETFs on February 11, 2026. Fund A charges a 0.10 percent expense ratio but trades with a 0.10 percent bid‑ask spread. Fund B charges 0.20 percent but has a much tighter 0.02 percent spread because it’s more popular and liquid. At purchase, crossing the spread costs you 0.05 percent, half the width, on the full ten‑million‑dollar notional. Over the next year your holdings gain 20 percent, bringing the total value to twelve million dollars. You decide to rebalance and sell two million dollars from each fund.
Fund A looks cheaper on paper with its lower expense ratio. The trading costs tell a different story. On the initial buy, you paid 0.05 percent on ten million, or five thousand dollars, in implicit spread cost. The annual expense ratio of 0.10 percent on an average balance of roughly eleven million, midway through the year, runs another eleven thousand dollars. At rebalance, you cross a 0.10 percent spread on the two‑million‑dollar sale, costing another 0.05 percent or one thousand dollars. Total cost over the year is around seventeen thousand dollars. Fund B’s higher 0.20 percent expense ratio on the same average balance costs twenty‑two thousand dollars, but its tighter spread means you paid only 0.01 percent, or one thousand dollars, on the initial buy and 0.01 percent, or one thousand dollars, on the rebalance. Total cost for Fund B is twenty‑four thousand dollars, which is higher, but the gap is much smaller than the 0.10 percent fee difference suggests. If you rebalanced more often, Fund A’s wider spread would pile on extra costs every time.
| Scenario | Expense Ratio | Bid‑Ask Spread | Total Cost Over One Year | Result |
|---|---|---|---|---|
| Fund A (lower fee, less liquid) | 0.10% | 0.10% | ≈$17,000 | Spread costs eat into fee advantage |
| Fund B (higher fee, more liquid) | 0.20% | 0.02% | ≈$24,000 | Higher annual fee but much lower trading friction |
| Fund A with frequent rebalancing | 0.10% | 0.10% | Rises with each trade | Spread cost compounds; can exceed Fund B total cost |
How Strategy, Holding Period, and Rebalancing Frequency Change ETF Cost Priorities
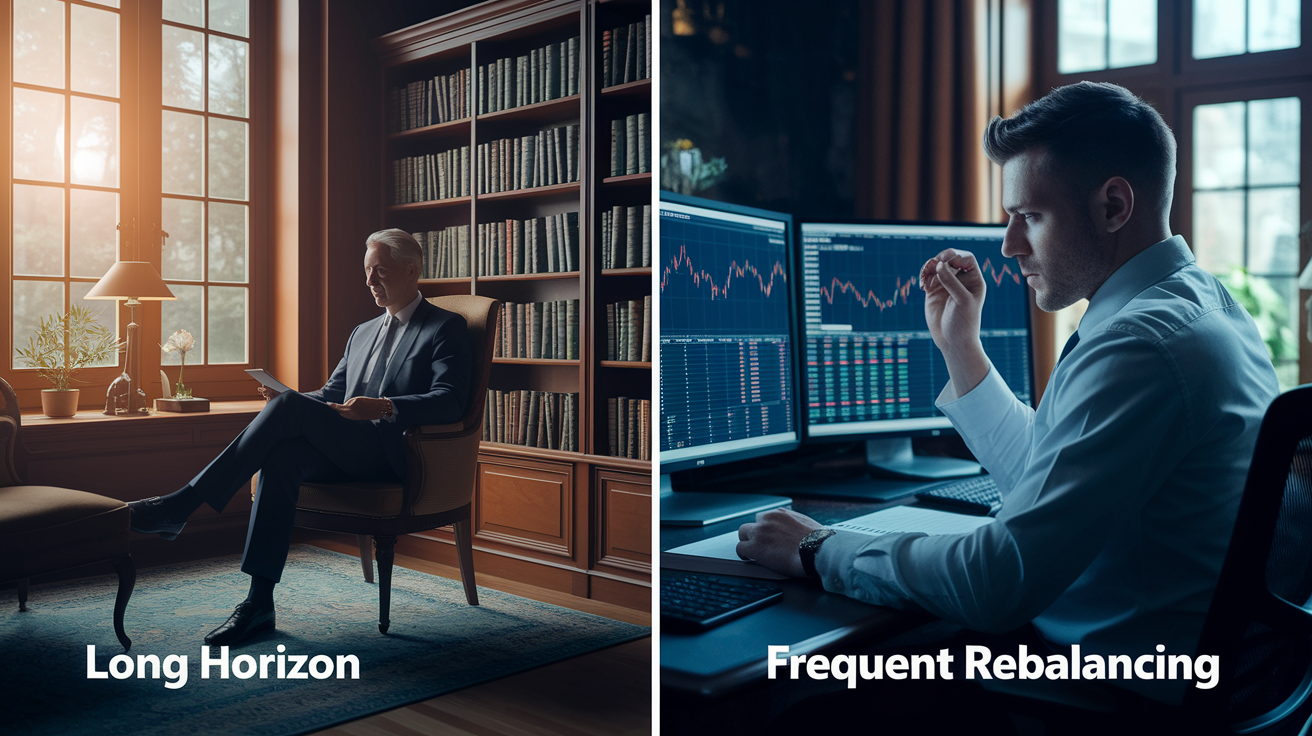
Your intended use changes which costs matter most. A buy‑and‑hold investor who plans to own shares for ten or twenty years will pay the expense ratio year after year, so even a small difference compounds into real money. Trading costs hit once on the way in and once on the way out, then disappear. For that investor, a fund charging 0.05 percent annually beats one charging 0.15 percent, even if the cheaper fund has a slightly wider spread. Over a decade, the 0.10 percent annual savings stacks up to more than a one‑time spread cost of a few basis points.
An active trader or tactical allocator who rebalances monthly, rotates among sectors, or adjusts exposure based on market signals pays spreads and potential commissions repeatedly. Every round trip resets the trading bill. If you move two million dollars four times a year, crossing a 0.10 percent spread each way costs 0.20 percent per round trip, or 0.80 percent over the year. That dwarfs a 0.10 percent difference in expense ratios. For frequent movers, liquidity and tight spreads become the top priority, even if it means accepting a modestly higher annual fee.
Portfolio turnover inside the fund also affects your cost. High‑turnover strategies, especially active or leveraged products, rack up internal trading costs that don’t appear in the expense ratio but show up as tracking error or performance drag. A fund that turns over its entire portfolio twice a year pays bid‑ask spreads and possible market impact on every trade, and those frictions leak into your returns. Checking the fund’s annual report for turnover percentage and comparing actual performance to its benchmark gives you a sense of how much those hidden frictions cost.
How to Match ETF Costs to Your Usage Pattern
If you’re building a long‑term core allocation, think retirement savings in a tax‑deferred account, focus first on expense ratios below 0.25 percent for equity and 0.20 percent for bonds. Then confirm the fund has reasonable liquidity so you can rebalance cleanly once or twice a year without drama. If you’re running a tactical sleeve or trading around shorter‑term views, prioritize high average daily volume and narrow spreads, even if the expense ratio sits ten or twenty basis points higher. One simple rule of thumb is to split your portfolio into a low‑cost, low‑turnover core and a smaller, more liquid sleeve for adjustments, so you only pay premium liquidity costs on the money that moves frequently.
Tools and Methods to Calculate and Compare ETF Total Cost

Calculating total cost of ownership by hand takes a few steps, but the math is straightforward. Start with holding cost, which equals the expense ratio times your average assets over the period. If you hold steady at fifty thousand dollars all year and the expense ratio is 0.20 percent, you pay one hundred dollars in annual fees. If your balance grows during the year, use the average. Next, estimate trading cost per transaction by taking half the bid‑ask spread, since you pay roughly half the spread each time you cross it, and multiply by the notional you’re buying or selling. Add any explicit commissions your broker charges. If you make multiple trades, sum them all up.
Combine holding and trading costs, then add estimated tax drag if you’re in a taxable account. Tax drag comes from capital gains distributions the fund makes, which trigger taxes even if you didn’t sell. Check the fund’s distribution history to see how much it paid out in prior years, then multiply by your marginal tax rate to estimate the annual hit. Tracking error, the gap between the fund’s return and its benchmark, can add or subtract a few basis points. If the fund consistently lags by 0.05 percent per year, treat that as another cost. Aggregate all those pieces to get a total cost number you can compare across different ETFs.
Here are five steps to calculate TCO manually:
- Find the fund’s net expense ratio in the prospectus or fact sheet and multiply by your expected average balance over the holding period to get annual holding cost.
- Look up the current or 30‑day average bid‑ask spread as a percentage, divide by two to estimate one‑way cost, then multiply by the dollar amount you plan to trade on entry and again on exit.
- Add any brokerage commissions or platform fees per trade, checking your broker’s fee schedule for ETF‑specific charges or account minimums.
- Estimate annual tax drag by reviewing the fund’s recent capital gains distributions, expressed as a percentage of NAV, and multiply by your tax rate if holding in a taxable account.
- Check the fund’s tracking difference over the past one to three years by comparing its total return to the benchmark’s total return, and factor that performance gap into your cost estimate as an annualized drag or boost.
Final Words
You learned the main cost pieces: expense ratio, holding versus trading costs, hidden fees like spreads and taxes, and how total cost of ownership ties them together.
Next steps are simple: find the expense ratio in the prospectus, check spreads and liquidity, compare similar funds, and run the basic TCO steps to see the real drag on returns.
A quick rule: long holds favor low expense ratios, frequent trading favors liquidity. Use this guide on how to assess an etf’s expense ratio and total cost to make steadier choices and keep moving forward.
FAQ
Q: What is the 7% rule in ETF?
A: The 7% rule in ETF is not a single industry standard; people sometimes use 7% as a rough expected annual return or an informal allocation cap—check the source and fund documents before using it.
Q: What is a good total expense ratio for an ETF?
A: A good total expense ratio for an ETF is generally low; for broad U.S. equity funds aim ≤0.25% and for bond ETFs under 0.20%. Higher fees may be acceptable for niche strategies.
Q: What is the 3 5 10 rule for ETFs?
A: The 3 5 10 rule for ETFs is not universal; investors often mean holding 3–5 core funds and limiting any single ETF to about 10% of the portfolio to avoid concentration risk.
Q: What is the 15 * 15 * 15 rule?
A: The 15 * 15 * 15 rule is not a standard ETF rule; when you encounter it, it may refer to fee, allocation, or return benchmarks in a specific model—ask the source and match it to your goals.
