

Want to be sure your ETF really owns what its sales page says?
A quick check of the fund’s index and holdings tells you what’s inside, and can spot surprises like big bets, cash cushions, or derivatives.
In this post I’ll show simple, fast steps you can do on the issuer’s website and a spreadsheet to verify the benchmark name, download the holdings file, and compare weights.
By the end you’ll know how to see what you truly own and why it matters.
How to Quickly Verify an ETF’s Benchmark Index and Holdings

The fastest way to check an ETF’s benchmark and holdings? Visit the fund issuer’s website and download the fact sheet and holdings file. Most issuers publish these on each ETF’s dedicated page, updated daily or monthly. The fact sheet names the exact benchmark index (for example, “S&P 500 Total Return Index”), while the holdings page lists every security the fund owns, along with each position’s weight as a percentage of total assets.
These sources are authoritative because they come straight from the fund manager and meet regulatory disclosure requirements. The prospectus provides legal detail about how the ETF tracks its benchmark. The holdings file shows exactly what the fund owns as of the stated date. Unlike third‑party platforms, the issuer’s documents are the official record used for compliance and investor reporting.
Update frequency varies by fund and document type. Most large ETF issuers refresh holdings daily, posting a CSV or Excel file with the previous business day’s positions. Fact sheets typically get updated monthly or quarterly. Prospectuses are filed annually or when material changes occur. Always note the “as of” date on any holdings file before making comparisons. That’s the date the data reflects, not the file’s publication date.
To verify an ETF’s benchmark and holdings in under 10 minutes:
- Go to the issuer’s ETF page. Search the issuer’s website for the fund’s ticker symbol to reach the dedicated product page.
- Open the fact sheet. Look for a PDF labeled “Fact Sheet,” “Fund Overview,” or “ETF Summary” to find the benchmark name and top holdings.
- Check the prospectus. Download the prospectus (often labeled “Statutory Prospectus” or “Full Prospectus”) to read the exact index methodology and replication approach.
- Review the holdings page. Click the “Holdings” or “Portfolio” tab and download the full holdings CSV or Excel file to see every position and its weight.
How to Interpret ETF Fact Sheets, Prospectuses, and Holdings Pages

The fact sheet is a one‑ to two‑page summary for quick screening. It names the benchmark index at the top or in a “Fund Details” box, lists the fund’s investment objective in plain language, and shows the top 10 holdings with their percentage weights. You’ll also see sector or country breakdowns (often as pie charts or bar graphs), the expense ratio, total assets under management, and sometimes a 1‑year tracking error figure. Use the fact sheet to confirm the index name and spot concentration risk. When the top 10 holdings represent more than 30 or 40 percent of the fund, you know a few stocks drive most of the return.
The prospectus goes deeper. In the “Principal Investment Strategies” section, it explains whether the ETF uses full replication (buying all index components), sampling (buying a representative subset), or synthetic replication (using swaps or derivatives to mimic the index). The prospectus also describes rebalancing rules and discloses risks such as securities lending, counterparty exposure, and currency hedging. If you see language like “the fund may hold fewer securities than the index” or “the fund uses optimization techniques,” expect some differences between the holdings list and the index constituents.
Holdings pages display every security the fund owns, usually in a sortable table or downloadable spreadsheet. Each row shows the ticker or ISIN, security name, number of shares held, market value, and weight as a percentage of net asset value. Pay attention to three things: cash position (a 2 to 3 percent cash buffer is normal, but 5 percent or more can signal liquidity issues or pending trades), derivatives (futures, swaps, or options listed separately), and non‑index holdings (securities not in the benchmark, which indicate sampling or tactical positions). Match the “Holdings as of” date with the index snapshot date before comparing weights. A one‑ or two‑day lag is common and usually harmless.
Update frequency matters when you’re checking alignment. Most large‑cap US equity ETFs post holdings daily, so you can see yesterday’s positions every morning. International, bond, and niche sector ETFs may update weekly or monthly. The prospectus will state the cadence. If a fund advertises daily transparency but the holdings file is two weeks old, contact the issuer’s client service to confirm the schedule. During index reconstitution events (S&P rebalances quarterly, Russell reconstitutes annually in June, MSCI reviews semi‑annually in May and November), expect short‑term differences as the ETF buys and sells to match the new index lineup.
How to Compare the Stated Index With the ETF’s Actual Holdings
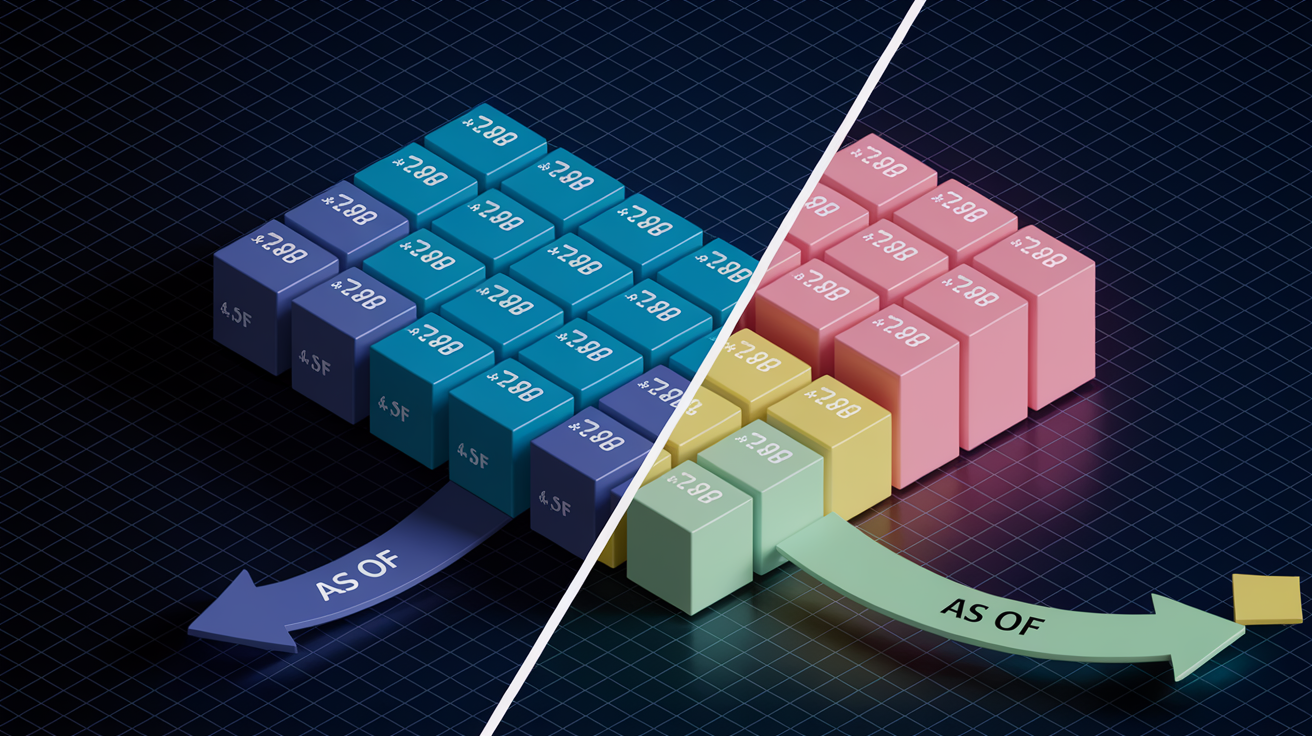
Start by confirming the exact index name and version in the fact sheet or prospectus. Then obtain the official constituent list from the index provider’s website (S&P, MSCI, FTSE Russell). Download both the ETF’s holdings file and the index constituent file for the same “as of” date, and match securities by ticker or ISIN in a spreadsheet. Compute the weight difference for each security (ETF weight minus index weight), then sum the absolute values of those differences and divide by two to estimate the total mismatch. For a fully replicated large‑cap ETF, the sum should be under 1 percent. For a sampling or optimized fund, 3 to 5 percent is typical.
Even when an ETF claims to track an index, you may find differences for valid reasons. Understanding these helps you separate normal operational variation from red flags.
Sampling or optimization. Some indexes have hundreds or thousands of components, and the ETF holds a smaller, statistically representative basket to reduce transaction costs and improve liquidity.
Liquidity filters. The fund may exclude the smallest or least liquid index constituents to avoid high trading costs and market impact.
Time lag. Index reconstitutions and corporate actions (mergers, spin‑offs, stock splits) happen on specific dates. The ETF may take a day or two to execute trades, causing temporary mismatches.
Corporate actions in progress. Between announcement and effective dates of mergers or share reclassifications, the ETF may hold cash or temporary placeholders.
Cash and derivatives. Funds hold cash for daily redemptions and may use futures or swaps to gain exposure when buying the underlying securities is impractical or expensive.
Evaluating an ETF’s Tracking Method and Tracking Error
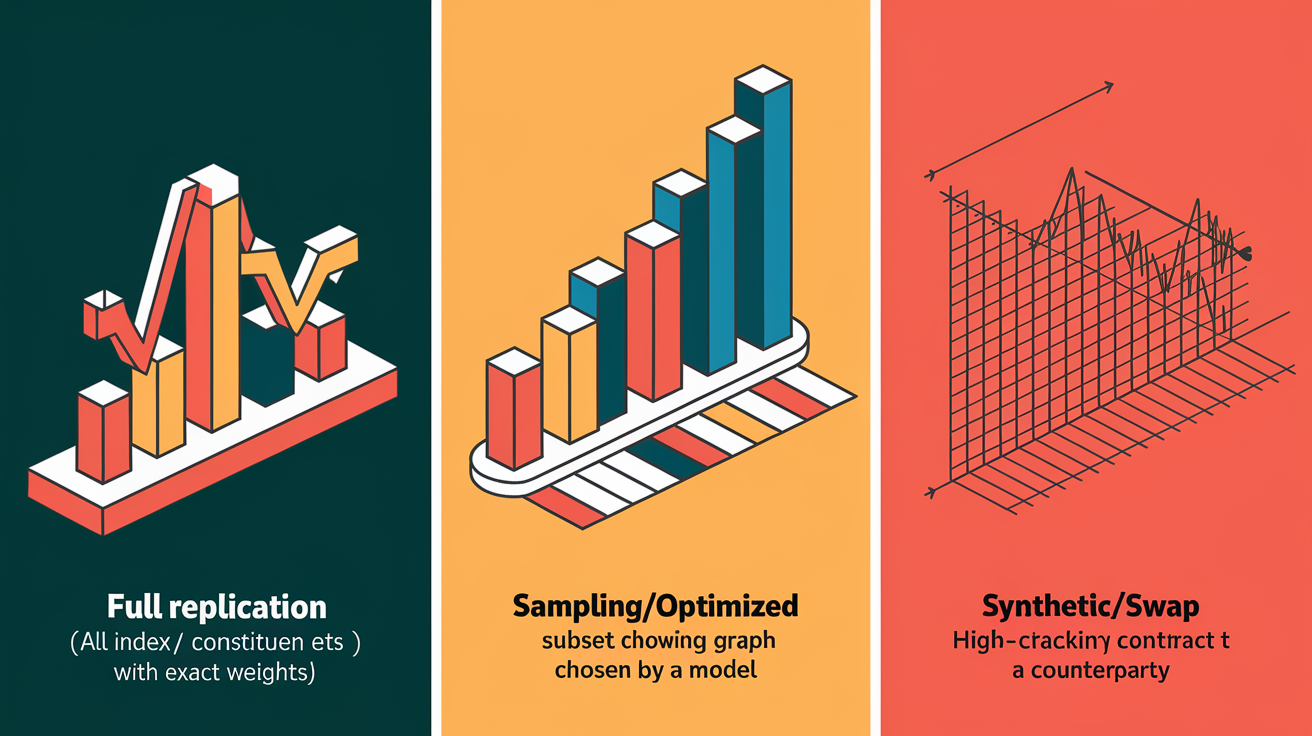
The tracking method determines how closely the ETF’s holdings mirror the index. Full replication means the fund buys every index security in the exact index weight, resulting in tight tracking and very low tracking error (often under 0.10 percent annually for large‑cap funds). Sampling or optimized replication means the fund uses quantitative models to select a subset of securities that collectively behave like the full index. This approach introduces small, systematic differences but reduces transaction costs, so tracking error typically runs 0.10 to 0.50 percent for broad indexes and higher for specialized or small‑cap indexes. Synthetic replication uses a total return swap with a counterparty, so the ETF may hold a basket of collateral securities unrelated to the index while the swap contract delivers the index return. Tracking error can be very low (near zero) if the swap is marked daily, but counterparty and collateral risk require close review.
Tracking difference measures the gap between the ETF’s actual return and the index return over a specific period (one year is common). A negative tracking difference means the ETF underperformed the index. A positive difference means it outperformed. Tracking error is the standard deviation of those period‑by‑period differences, capturing how consistently the fund tracks its benchmark. For long‑term buy‑and‑hold investors, tracking difference matters most because it shows cumulative cost. For traders and tactical allocators, tracking error matters more because it reveals day‑to‑day or month‑to‑month volatility around the index. Both metrics are reported in the prospectus or annual report, often as a percentage or in basis points (100 basis points equals 1 percent).
Check the fund’s tracking performance over multiple periods (one, three, and five years) to spot trends. Persistent annual tracking differences above 0.50 percent for a low‑cost, physically replicated large‑cap ETF suggest high turnover, poor execution, or undisclosed fees. Tracking error that spikes during market stress may indicate liquidity constraints or heavy use of derivatives. The table below summarizes typical behavior for each replication method.
| Replication Method | Description | Typical Tracking Behavior |
|---|---|---|
| Full Replication | Holds all index constituents at index weights | Very low tracking error (0.01–0.10%), minimal tracking difference |
| Sampling / Optimized | Holds a representative subset chosen by statistical model | Low to moderate tracking error (0.10–0.50%), small tracking difference from reduced trading costs |
| Synthetic / Swap | Uses derivative contracts to deliver index return | Near‑zero tracking error if swap marked daily; introduces counterparty risk instead |
Reliable Sources for Cross‑Checking ETF Data

The U.S. Securities and Exchange Commission’s EDGAR database provides official regulatory filings, including the statutory prospectus, N‑PORT quarterly holdings reports, and annual/semi‑annual shareholder reports (Forms N‑CSR). Search by the fund’s ticker or the issuer’s company name to access these documents for free. EDGAR filings are the legal record and include detailed risk disclosures, fee tables, and historical performance data required by law. Use EDGAR when you need to verify prospectus language about replication methods, securities lending policies, or derivative usage, or when you want holdings data for a fund that doesn’t publish daily files on its website.
Third‑party platforms offer independent analysis and tools that make cross‑checking easier. Morningstar compiles fund fact sheets, calculates standardized tracking error, assigns style‑box classifications, and provides comparison charts across similar ETFs. Bloomberg Terminal and Refinitiv Eikon offer real‑time holdings data, index constituent lists, and analytics for institutional users. Yahoo Finance and ETFdb.com provide free summary data, including benchmark name, top holdings, expense ratio, and historical returns, useful for quick sanity checks before downloading full files. Always compare the “as of” date on third‑party data to the issuer’s official holdings date. Lags of a few days are normal, but weeks‑old data may reflect outdated positions.
When cross‑checking, prioritize these sources in order:
Issuer’s official holdings page (CSV or Excel download)
Fund prospectus and annual report (issuer site or EDGAR)
Morningstar ETF profile for independent metrics and peer comparisons
Index provider methodology documents (S&P, MSCI, FTSE Russell) for official constituent lists and rebalancing rules
Final Words
Start by going to the issuer’s ETF page, open the fact sheet, and review the holdings page. Those quick checks show the benchmark name, top holdings, and the fund’s stated approach.
Next, read the prospectus for index rules, compare the actual holdings to the index, and note the replication method and tracking error. Use EDGAR or a trusted data site to cross-check anything that looks off.
If you want one clear action, follow the four steps above to learn how to check an ETF’s underlying index and holdings so you can pick funds with more confidence and calm.
FAQ
Q: How do I see all holdings of an ETF?
A: The way to see all holdings of an ETF is to check the issuer’s holdings page, fact sheet, or prospectus—those show full or partial lists, updated regularly (often daily) and easy to download.
Q: Do ETFs have underlying assets / Do ETFs hold underlying stocks?
A: ETFs do hold underlying assets like stocks or bonds; the ETF owns those assets and you own shares of the fund, so check the ETF’s holdings page to see exact assets and weights.
Q: What is the 7% rule in ETF?
A: The 7% rule in ETFs refers to a concentration guideline used by some funds to limit any single holding to about 7 percent, helping spread risk; not all ETFs follow this—check the prospectus.

