

What if the 4% rule is leaving money on the table?
For a 20-year retirement, you can often safely withdraw more, typically 5% to 6% of your starting balance, adjusted each year for inflation.
This shorter horizon lowers the chance of running out, but the right rate still depends on market conditions, guaranteed income like Social Security or a pension, and how much spending flexibility you have.
Read on for simple rules, real-dollar examples, and a quick test you can run this week to pick your number.
Determining a Safe Withdrawal Percentage for a 20‑Year Retirement Horizon

A safe withdrawal rate for a 20 year retirement typically lands between 5% and 6% of your starting balance, taken in year one and bumped for inflation after that. This sits well above the famous 4% rule, and for good reason. You’re spending over a shorter window. Twenty years means you dodge the risk of those brutal multi decade bear markets, so you can pull more income without wrecking your nest egg early. If your plan is to spend everything down by year 20, you can afford to be more aggressive than someone who needs their money to last 30 or 40 years.
But the right number for you depends on a few things. Retiring when stocks are expensive? Bond yields in the basement? High fees eating into your returns? In those cases, you’ll want to stay closer to 5%, maybe even 4.5%. On the other hand, if you’ve got Social Security, a pension, or an annuity kicking in somewhere during those 20 years, you can safely withdraw more. Those guaranteed payments take pressure off your portfolio.
Here’s what different withdrawal rates look like in actual dollars:
- $500,000 portfolio: 5% gives you $25,000/year; 6% gives you $30,000/year
- $1,000,000 portfolio: 5% = $50,000/year; 6% = $60,000/year
- $1,500,000 portfolio: 5% = $75,000/year; 6% = $90,000/year
- $2,000,000 portfolio: 5% = $100,000/year; 6% = $120,000/year
- $3,000,000 portfolio: 5% = $150,000/year; 6% = $180,000/year
Start around 5%, run it through historical data or simulations for your asset mix, then tweak up or down based on your tolerance for risk, how flexible your spending can be, and what the market looks like when you actually retire.
How a 20‑Year Withdrawal Rate Differs from the Traditional 4% Rule

The 4% rule came out of the Trinity Study and similar research focused on 30 year retirements. It was designed to give retirees about a 96% chance of not running dry, based on rolling 30 year historical periods. Researchers tested withdrawal rates from 3% all the way to 8% across different stock and bond mixes. They found that 4%, adjusted for inflation each year, survived almost every 30 year stretch. A 3% rate never failed. But 5% only made it through about two thirds of the periods, and 6% or higher failed roughly half the time.
Shorten your retirement to 20 years and the math shifts in your favor. Fewer years of market exposure means you can support a higher withdrawal rate. Historical simulations show that even aggressive rates have decent survival odds over two decades. A 75/25 stock/bond portfolio withdrawing 9% annually ran out of money about half the time across 20 year periods. Drop that to 5% or 6% and success rates jump way up, even when you include nasty stretches like the Great Depression, 1970s stagflation, and the 2008 crash.
| Horizon | Typical SWR | Historical Survival Rate | Notes |
|---|---|---|---|
| 30 years | 4% | ~96% | Classic Trinity baseline for balanced portfolios |
| 20 years | 5%–6% | >90% | Shorter exposure allows higher initial draw |
| 40+ years | 3.5%–4% | Varies | Extended horizon requires lower rate for safety |
Bottom line: if you only need your portfolio to last 20 years, the traditional 4% rule leaves money sitting there. You can safely take more. But you still need to respect sequence of returns risk and what the market’s doing when you start withdrawing.
Market Conditions, Inflation, and Sequence Risk for 20‑Year Withdrawals

Sequence of returns risk is the danger that lousy market performance early in retirement, combined with ongoing withdrawals, drains your portfolio before later recoveries can rescue you. Even if long term average returns look solid, the order matters enormously once you start spending. Historical analysis shows that the real return you earn in your first 10 years of retirement is the single strongest predictor of whether your plan works, with a correlation around 0.79. Your portfolio drops hard in years one through three and you keep taking inflation adjusted withdrawals? You’re selling assets at depressed prices, locking in losses and shrinking the base for future gains. That’s why retirees who started in 1929, 1937, 1965, or 1966 faced the highest historical failure rates, even though stocks eventually came back.
Inflation adds another wrinkle. Committing to inflation adjusted withdrawals means a sudden spike in living costs forces you to pull out more dollars just when your portfolio might be struggling. Over 20 years, inflation variability matters less than over 40, but it still requires careful planning. Real yields, the return you earn above inflation, drive safe withdrawal capacity more than nominal returns. Research shows starting valuations, measured by things like the Shiller CAPE ratio, correlate strongly with sustainable withdrawal rates, around 0.77 in the data. When stocks are pricey at the start of your retirement, expected future real returns typically run lower, which means you should lean toward the conservative end of the range.
The historical record includes every major crisis of the past century. Great Depression. World War II inflation. The 1970s stagflation and energy shocks. The 1987 crash. Russian default and Long Term Capital Management in the late 1990s. Dot com bust. 2008 financial crisis. Multiple emerging market contagions. Crypto winters. COVID pandemic. A 20 year retirement starting today will hit some mix of recession, inflation surprise, geopolitical shock, or sector crash. The question isn’t whether bad things will happen. It’s whether your plan can survive them without forcing you to cut spending to zero or go back to work in your 70s.
Why the First 10 Years Matter Most
The first decade is the most dangerous window. A strong start gives your plan breathing room. A weak start can cripple it permanently. Research quantifies this: the correlation between your first 10 years of real returns and the ultimate success of your withdrawal strategy is 0.79, far higher than the correlation with any single year or even your 30 year average return. Retire into a bear market and keep withdrawing at a fixed percentage? You might find yourself holding a portfolio half the size of your starting balance within a few years. At that point, even a roaring bull market can’t fully repair the damage. That’s why many retirees build a one to three year cash buffer or adopt dynamic withdrawal rules that cut spending temporarily after severe losses.
Asset Allocation Guidance for a 20‑Year Retirement Plan

For a 20 year retirement, research suggests an equity allocation between 60% and 80%, paired with 20% to 40% in intermediate term government bonds. This mix balances growth and stability. Stocks give you the long term returns needed to sustain withdrawals, especially if inflation runs hotter than expected. Bonds dampen short term swings and provide a stable cash source during equity bear markets, so you’re not forced to sell stocks at a loss. A 50/50 split is a reasonable conservative baseline, but many 20 year retirees can afford more equities. Two decades is still long enough for stock market recoveries to play out. Historical simulations show portfolios tilted 70/30 or even 80/20 toward stocks have supported withdrawal rates above 5% in most 20 year periods, assuming the retiree could stomach the volatility.
Rebalancing your portfolio every three to six months offers a slight historical edge, about 0.01% improvement in outcomes. It’s not a game changer, but it’s a simple discipline that keeps your allocation on target by systematically selling high and buying low. “Bucket” strategies sound appealing. You divide your portfolio into short term cash, intermediate bonds, and long term stocks. But they provide no consistent advantage over a straightforward two asset allocation with regular rebalancing. In fact, bucketing can increase trading costs and complexity without improving survivability. Similarly, popular “yield shield” strategies relying on high dividend stocks or funds to generate income have historically underperformed in severe downturns. 2008 and 2020, for example. Dividend cuts and price declines hit at the same time.
Consider these allocation examples for a 20 year plan:
- 60/40 stocks/bonds: Conservative baseline with stable income. Supports a 5% withdrawal in most historical periods.
- 70/30 stocks/bonds: Moderate growth tilt. Historically supports 5.5% to 6% with reasonable volatility.
- 80/20 stocks/bonds: Aggressive growth for retirees comfortable with swings. Can support 6%+ in favorable conditions.
- Glidepath (start 80% equity, end 50% equity): Gradually reduces stock exposure over the 20 years to lower late period volatility.
- Buffer bucket (2 years cash + remainder 70/30): Holds cash to cover withdrawals during the first two years. Replenish cash from bonds and stocks annually.
- Intermediate bond ladder (10 year Treasuries): Mature bonds provide predictable cash flow. Can be paired with equity sleeve for growth.
Skip exotic tilts to gold, small cap value, or momentum strategies unless you have a deep understanding of their behavior. Gold helped in the 1970s and during the Great Depression, but it’s been dead weight in many other periods. Small cap value doesn’t materially raise safe withdrawal rates according to recent backtests. If you want simplicity, stick to a low cost total stock market fund and an intermediate term government bond fund, rebalanced quarterly.
Fixed, Variable, and Dynamic Withdrawal Strategies for a 20‑Year Horizon

A fixed withdrawal strategy means you take a set percentage of your starting portfolio value, say 5%, in year one. Then you adjust that dollar amount for inflation every year, no matter how your portfolio performs. Simple and predictable. But also rigid. Your portfolio drops 30% in year two and you still take an inflation adjusted withdrawal based on your original balance? You’re now withdrawing a much higher percentage of your smaller nest egg, which accelerates depletion. Fixed strategies work fine when returns cooperate. They carry the highest risk of total failure during severe early bear markets.
Variable and dynamic withdrawal strategies adjust your spending each year based on portfolio performance, market conditions, or predefined rules. The simplest variable approach is to withdraw a constant percentage of your current portfolio value each year, say 5% of whatever balance you have on January 1. This guarantees you’ll never run out of money. You can always take 5% of something. But it also means your income will swing wildly year to year. Portfolio drops 25%? Your next withdrawal drops 25%. Many retirees find that volatility unacceptable. More sophisticated dynamic rules try to smooth spending while still protecting against ruin. The Guyton Klinger guardrails method, for example, adjusts your inflation increases only when your portfolio stays within preset performance bands. Portfolio falls too far? You skip the inflation raise or even cut spending. It rises significantly? You can increase withdrawals. This reduces failure risk but can lead to years of stagnant or declining real income.
Valuation based rules, such as CAPE adjusted withdrawal rates, scale your spending up or down based on whether stocks are cheap or expensive. When the Shiller CAPE is high, you withdraw less. When it’s low, you withdraw more. Historical backtests show these rules produce more muted year to year variability than percentage of portfolio methods and avoid many unnecessary deep cuts. There are also amortization based methods like Variable Percentage Withdrawal (VPW), which uses a precomputed table to tell you what percentage to withdraw each year based on your remaining horizon. Amortization Based Withdrawals (ABW) recalculates the maximum sustainable withdrawal annually given current expected returns and time remaining. Total Portfolio Allocation & Withdrawal (TPAW) goes further, dynamically adjusting both your asset allocation and your withdrawal rate as you age.
When to Prefer Dynamic Rules Over a Fixed Rate
Choose a dynamic withdrawal rule if you value long term portfolio survival over stable year to year spending. Dynamic rules significantly reduce the chance of complete failure, but they do it by cutting your income when markets struggle. In historical backtests, retirees using guardrails or valuation based adjustments often endured five to ten years of reduced spending before markets recovered enough to restore withdrawals. If you’ve got the flexibility to trim discretionary expenses, delay major purchases, or pick up part time income when necessary, dynamic rules offer real protection. For a 20 year retirement, you can pair a dynamic rule with a slightly higher starting withdrawal rate, 5.5% or 6%, because the shorter horizon and your willingness to cut spending both lower your risk of ruin.
Using Data, Backtesting, and Monte Carlo for a 20‑Year Withdrawal Rate

Historical backtesting uses actual past market returns, typically 100+ years of stock, bond, and inflation data, to simulate what would have happened to a retiree who started withdrawals in every possible historical year. Model a retiree who started in 1929, another who started in 1930, and so on through 2024. See how often each withdrawal rate succeeded over the following 20 years. This approach captures real crises, real correlations, and real human behavior. Panic selling, policy errors, wars. But it’s limited to what’s already happened. If future returns, inflation, or volatility differ structurally from the past, maybe because of demographic shifts, climate disruption, or a prolonged low return environment, historical results may not repeat.
Monte Carlo simulation generates thousands of hypothetical future return sequences based on assumed average returns, volatility, and correlations. It explores a much wider range of possible outcomes than the limited number of independent historical periods. The U.S. historical record contains only about three or four truly independent 20 year retirement cohorts. Monte Carlo studies typically confirm that a 5% to 6% initial withdrawal rate for a 20 year horizon has a high probability of success, often 85% to 95%, when using balanced or stock heavy allocations and reasonable return assumptions. However, Monte Carlo results are sensitive to the inputs you choose. Plug in overly optimistic expected returns or underestimate volatility? The simulation will tell you an aggressive withdrawal rate is safe when it may not be.
To run a meaningful analysis for your 20 year plan, model these inputs carefully:
- Expected real returns: Use conservative estimates, perhaps 5% to 6% real for a balanced portfolio, rather than the historical long run average, especially if current valuations are elevated.
- Volatility and correlation assumptions: Match them to historical norms for your asset mix. Don’t assume stocks and bonds will always move independently.
- Tax and fee drag: Include an explicit deduction for investment fees, expense ratios, advisory fees, and estimate your marginal tax rate on withdrawals from taxable and tax deferred accounts.
- Valuation regime at retirement: If starting CAPE or bond yields are far from historical averages, adjust expected returns downward or upward. Some tools allow regime conditional simulations.
Run multiple scenarios. Test your chosen withdrawal rate at 60/40, 70/30, and 80/20 allocations. Stress test by assuming poor early returns, a 2008 style crash in year one. Compare fixed inflation adjusted withdrawals to a Guyton Klinger or CAPE based dynamic rule. The goal isn’t to find a single “correct” number. It’s to understand the range of outcomes and the tradeoffs between spending stability and portfolio longevity.
Practical 20‑Year SWR Examples and Step‑By‑Step Calculations
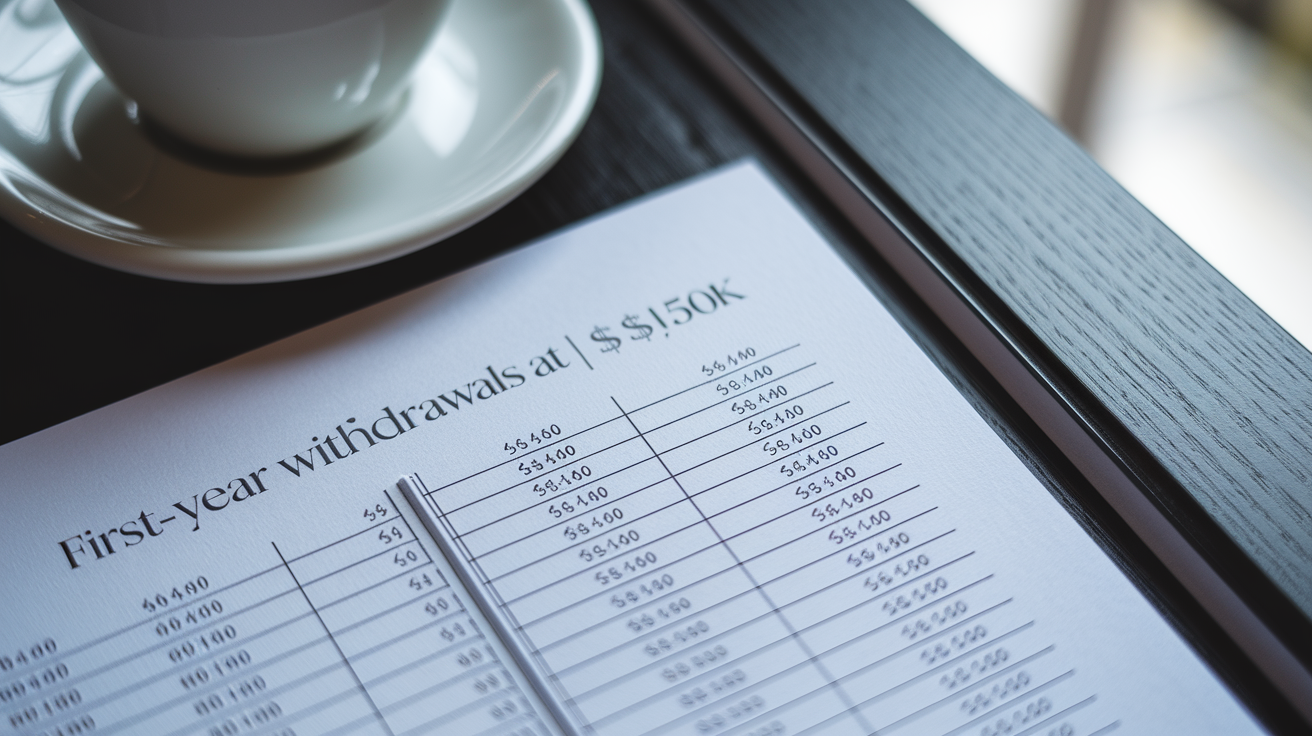
Here are real dollar first year withdrawal amounts for three common portfolio sizes at 4%, 5%, and 6% rates. These are nominal dollars before taxes. You’ll adjust upward for inflation in later years.
| Portfolio | 4% withdrawal | 5% withdrawal | 6% withdrawal |
|---|---|---|---|
| $500,000 | $20,000 | $25,000 | $30,000 |
| $1,000,000 | $40,000 | $50,000 | $60,000 |
| $2,000,000 | $80,000 | $100,000 | $120,000 |
These numbers show the size of the choice. Moving from a 4% to a 6% withdrawal rate boosts your first year income by 50%. On a $1,000,000 portfolio, that’s an extra $20,000 per year. A meaningful bump to your standard of living. But it also raises the risk your portfolio won’t last the full 20 years if returns disappoint early. You’ve got a $2,000,000 nest egg and withdraw $120,000 in year one? You’re betting a 70/30 or 80/20 allocation will deliver enough growth to offset that draw. Historical data supports that bet in most periods. Not all.
To calculate your own safe withdrawal rate for a 20 year horizon, follow these steps:
- Estimate your annual spending need: Include all expenses. Housing, food, travel, healthcare, insurance premiums. Add 10% as a buffer for surprises.
- Subtract guaranteed income sources: Deduct Social Security, pension payments, rental income, or annuity payments that will arrive during your 20 year window. The remainder is what your portfolio must cover.
- Divide your spending need by your portfolio balance: You need $50,000 per year from a $1,000,000 portfolio? Your initial withdrawal rate is 5%.
- Run a historical backtest or Monte Carlo simulation: Use a free online calculator or spreadsheet tool to model your chosen rate, asset allocation, and withdrawal method over 20 years. Check the success rate, the percentage of simulations or historical periods that didn’t run out of money.
- Adjust the rate based on results and risk tolerance: Success rate below 85%? Lower your withdrawal percentage or increase your equity allocation. Above 95% and you’re comfortable with volatility? You might raise the rate slightly.
Remember that “success” in these models typically means ending with at least $1 left. Want to leave a bequest or maintain a cushion for unexpected late life expenses? Target a higher success rate or plan for a lower withdrawal percentage.
Integrating Taxes, Fees, and Guaranteed Income Into a 20‑Year Withdrawal Plan

Every dollar you withdraw to spend must first cover taxes and investment fees, which means your actual portfolio withdrawal will be higher than your net spending. You need $100,000 per year for living expenses and expect to pay $20,000 in federal and state income taxes plus $2,000 in advisory and fund fees? You must withdraw $122,000 from your portfolio. This distinction is critical when setting a safe withdrawal rate. A 5% rate on a $1,000,000 portfolio gives you $50,000 gross. After taxes and fees, your net might be only $40,000 or $42,000. Always model your withdrawal rate on a gross basis, then subtract the tax and fee burden to see what you actually have available to spend.
Tax efficient withdrawal sequencing can extend your portfolio’s life. The standard rule of thumb is to drain taxable accounts first, then tax deferred accounts like traditional IRAs and 401(k)s, and finally Roth IRAs. This順序 minimizes your lifetime tax bill because you let tax deferred accounts continue compounding and delay Roth withdrawals, which are tax free and valuable in high tax years. However, if you retire before age 59½, you may need to use taxable accounts or Roth contributions, which can be withdrawn penalty free, to bridge the gap until you can access retirement accounts. After age 73, or 75 depending on your birth year, required minimum distributions force withdrawals from traditional IRAs regardless of your needs. This can push you into higher tax brackets and reduce flexibility.
Guaranteed income sources like Social Security, pensions, and annuities dramatically improve the safety of your withdrawal plan because they reduce the burden on your investment portfolio. Delaying Social Security from age 62 to age 70 increases your monthly benefit by roughly 75%, and those payments are indexed to inflation for life. For someone in good health with longevity in their family, the real internal rate of return on delaying Social Security often exceeds 3%, comparable to or better than the real yield on Treasury Inflation Protected Securities. Cover your first few years of retirement by drawing down your portfolio or working part time? Delaying Social Security until 70 provides a powerful income floor that supports a higher withdrawal rate from your remaining assets.
Consider these tools for creating an income floor in a 20 year plan:
- Delay Social Security to age 70: Maximizes lifetime inflation indexed income if you expect to live into your mid 80s or beyond.
- Single Premium Immediate Annuity (SPIA): Convert a lump sum into guaranteed monthly payments for life or a fixed period. Shop multiple insurers for the best payout rate.
- TIPS ladder: Buy individual Treasury Inflation Protected Securities maturing in sequential years to create known real cash flows. A 20 bond ladder, one bond maturing each year, gives you predictable inflation adjusted income.
- Pension integration: If you have a pension, coordinate the start date with your portfolio withdrawals. Some pensions offer lump sum buyouts that you can roll into an IRA or use to purchase an annuity on the open market.
The more guaranteed income you have, the higher the safe withdrawal rate from your remaining portfolio. Social Security and a small pension cover 60% of your spending? You can afford to take 6% or even 7% from your investments because a market crash affects only the discretionary portion of your budget.
Final Words
Start in the action: for a 20-year retirement, a practical starting range is 5%–6% of your portfolio in year one. It’s higher than the 4% 30-year rule, but hinges on stock mix, valuations, early returns, taxes, and fees.
Next steps: pick an allocation (60%–80% equities is common), run a quick backtest or Monte Carlo, and consider guardrails or an income floor to protect against bad early years.
Try a 5% starting withdrawal and adjust with guardrails. The safe withdrawal rate for 20-year retirement gives breathing room and a clear path. You can do this.
FAQ
Q: How many Americans have $1,000,000 in their 401k?
A: The number of Americans who have $1,000,000 in their 401(k) is very small — roughly one percent or less of 401(k) account holders, concentrated among older, higher earners.
Q: What is Dave Ramsey’s 8% rule?
A: Dave Ramsey’s 8% rule refers to withdrawing 8% of your retirement balance each year, an aggressive starting rate compared with 4% that raises the risk of running out of money sooner.
Q: Why is the 4% rule too conservative?
A: The 4% rule is too conservative for shorter retirements because it was built for 30‑year spans; a 20‑year horizon often supports 5%–6%, though outcomes depend on returns, valuations, and taxes.
Q: How long will a 6% withdrawal rate last?
A: A 6% withdrawal rate will typically last through a 20‑year retirement in many historical cases with a balanced mix, but survival hinges on early returns, market valuation, fees, and taxes.

