

Think dividend ETFs are boring?
They can be a steady income engine or a tax and timing puzzle if you don’t know the rules.
This post cuts through the noise and compares Vanguard’s top dividend funds (VYM, VIG, VYMI), their yields, fees, and when they pay.
You’ll get simple rules for choosing between higher current income or dividend growth, plus a clear look at ex-dividend dates, reinvestment, and international tax and currency effects.
Top Vanguard Dividend ETFs and Their Dividend Yields
VYM (Vanguard High Dividend Yield ETF) goes after large U.S. companies paying above-average dividends. You’re looking at established businesses with a track record of steady payouts. Mid-2024, VYM delivered a trailing twelve-month yield around 3.0–3.2%, which gives you practical income if you need cash flow now. The expense ratio is 0.06%, one of the lowest you’ll find. VYM pays quarterly, usually March, June, September, and December. The portfolio leans toward financials, consumer staples, healthcare, and energy. Sectors that pay regularly.
VIG (Vanguard Dividend Appreciation ETF) takes a different approach. It focuses on U.S. companies that have raised dividends every year. The fund screens for businesses that increased payouts over time, cutting out firms that froze or slashed dividends. VIG’s trailing yield sits around 1.7–2.0% (mid-2024), noticeably lower than VYM. But here’s the thing: the underlying holdings historically grew dividends at a 6–8% annual rate over the past decade. VIG also charges 0.06% and distributes quarterly. This works if you want income that rises over the years, even when the starting payout feels modest.
VYMI (Vanguard International High Dividend Yield ETF) captures higher yields outside the U.S. The fund holds companies across developed and emerging markets, giving you geographic spread. Mid-2024 figures show VYMI with a trailing yield near 3.3–3.8%, the highest of the three. Expense ratio runs around 0.08%, still low but slightly above the U.S. funds. VYMI pays quarterly. Because the portfolio includes foreign companies, dividends often face withholding taxes from the countries where those companies are based. Currency swings also influence the dollar value of distributions, adding complexity you don’t get with domestic dividend funds.
| Ticker | Yield (TTM) | Expense Ratio | Payout Frequency |
|---|---|---|---|
| VYM | ~3.0–3.2% | 0.06% | Quarterly |
| VIG | ~1.7–2.0% | 0.06% | Quarterly |
| VYMI | ~3.3–3.8% | 0.08% | Quarterly |
Understanding Vanguard Dividend Payouts and How They Work
Vanguard dividend ETFs collect income from the stocks they hold and pass that income to shareholders as distributions. When a company in the portfolio pays a dividend, the ETF receives the cash. The fund aggregates all dividend income from its holdings, along with any interest or short-term capital gains from portfolio management, and distributes the total to ETF shareholders on a set schedule. Most Vanguard dividend ETFs pay quarterly. You receive four distributions per year. These distributions reflect the income earned during the previous three months.
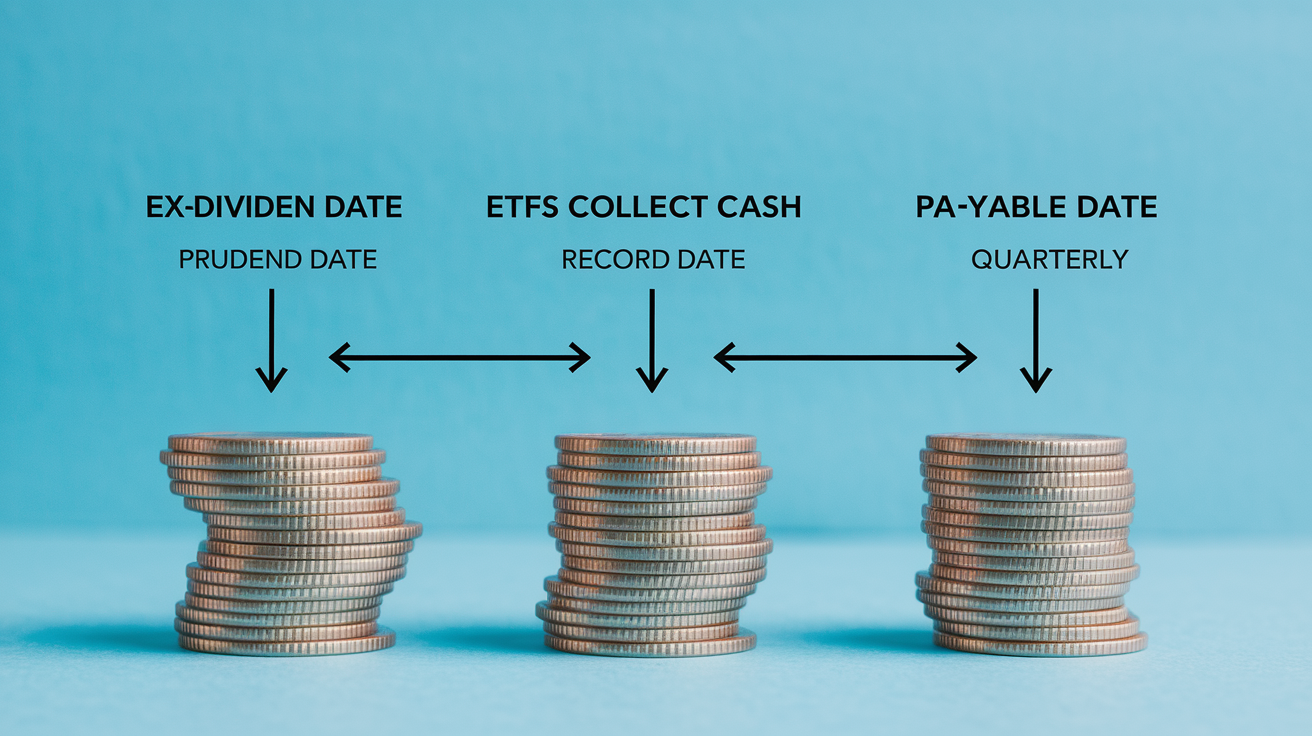
Three key dates determine who gets paid and when. The ex-dividend date is the cutoff. You must own shares before this date to qualify for the upcoming distribution. Buy shares on or after the ex-dividend date and you miss that payment. The record date, usually one or two business days after the ex-dividend date, is when the fund takes a snapshot of all shareholders eligible to receive the payout. The payable date is when cash actually lands in your brokerage account or gets reinvested into additional shares. The gap between the ex-dividend date and the payable date is typically a few weeks.
You have two choices when you receive a distribution: take cash or reinvest. If you elect cash, the dividend appears as cash in your brokerage account. Spend it or invest elsewhere. If you choose reinvestment, the distribution automatically buys more shares of the ETF, sometimes fractional shares, at the price on the payable date. Reinvestment compounds your position over time without requiring new cash outlays, though you still owe taxes on the distribution in taxable accounts even if you never see the cash.
- Ex-dividend date: last day to buy shares and qualify for the distribution.
- Record date: fund records all eligible shareholders a day or two after ex-dividend date.
- Payable date: distribution cash or shares delivered to your account.
- Distribution type: cash received or automatically reinvested into more shares.
- Reinvestment or cash: choose based on income needs and compounding goals.
Comparing Vanguard Dividend Yields: SEC Yield vs Trailing Yield

SEC yield uses a standardized 30-day formula required by regulators. Easy to compare funds side by side. The calculation assumes income earned over the past 30 days annualizes evenly. Trailing twelve-month yield adds up the actual cash distributed over the past year and divides by the fund’s current price. Trailing yield shows what you really got. SEC yield projects what you might get if the recent month repeats for a full year.
Both numbers shift when the fund’s price changes. If the ETF price drops but distributions stay steady, yield rises. You get the same income for less cost. If the price climbs, yield falls. Yield on cost measures your personal return by dividing annual income by your original purchase price. Useful for long-term holders tracking how their dividend stream has grown. Forward yield is an estimate based on recent distributions projected ahead, often less reliable because payouts can change.
- SEC yield: standardized 30-day snapshot, useful for quick fund comparisons.
- Trailing twelve-month yield: actual cash paid over the past year divided by current price.
- Forward yield: projection of next year’s distributions based on recent trends.
- Yield on cost: annual income divided by your original purchase price, not current market price.
For dividend investors focused on income, trailing twelve-month yield is the most concrete number. It reflects real money you received. SEC yield is helpful when comparing two funds at the same moment, but trailing yield tells you what the fund actually delivered.
Vanguard Dividend Growth vs High-Yield Strategies
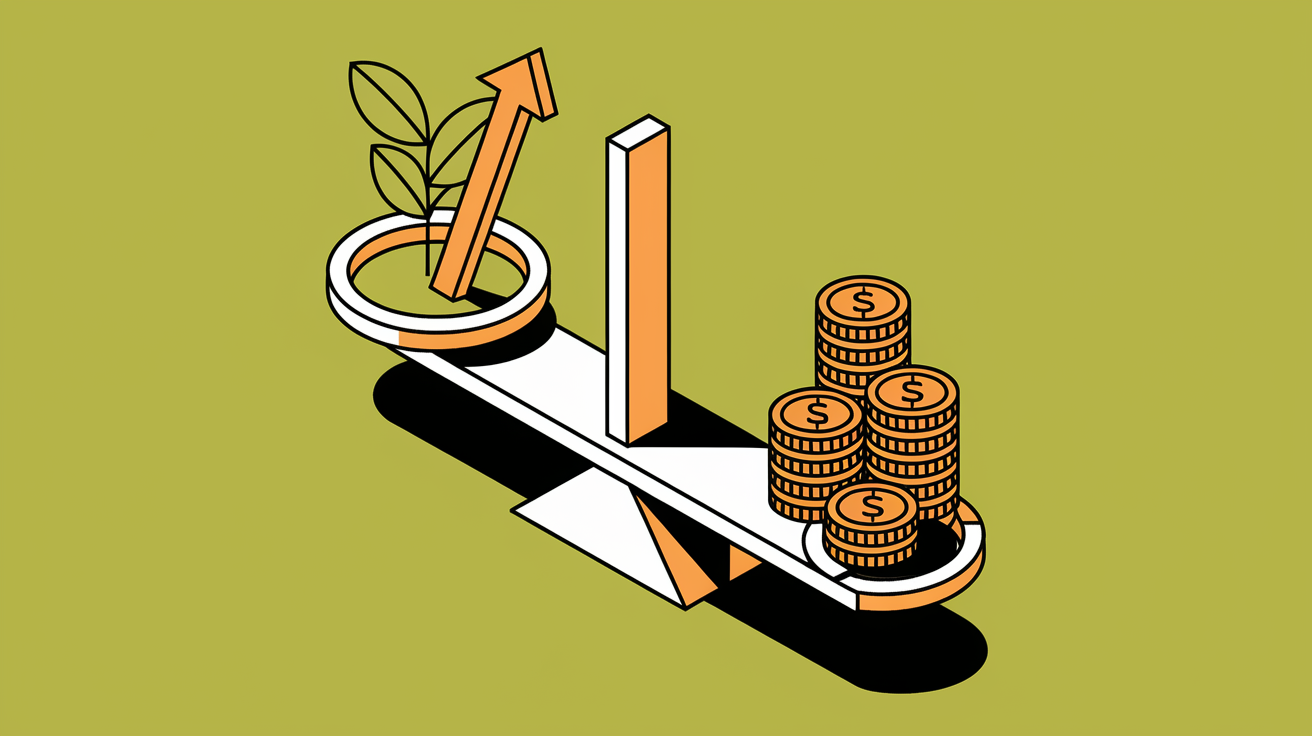
Dividend growth investing goes after companies that raise their payouts regularly, even if the starting yield is low. VIG fits this approach. The fund’s holdings historically increased dividends around 6–8% per year over the past decade, faster than inflation and wage growth in many periods. Starting yield might be only 1.7–2.0%, but in ten years that income stream can nearly double if growth continues. Dividend growth strategies also tend to hold companies with lower payout ratios. They keep more earnings to reinvest in the business or raise dividends further.
High-yield strategies, like VYM, deliver more income today. A 3.0–3.2% yield generates immediate cash flow, attractive if you’re retired or need current income. However, high-yield portfolios often tilt toward mature industries. Utilities, financials, energy. Growth is slower there. Over the past decade, VYM’s underlying dividends grew around 3–5% annually, roughly half the rate of VIG. Higher starting yield, lower long-term growth. International high-yield funds like VYMI face even more variability due to economic cycles in different countries and currency swings.
Payout ratio matters when choosing between growth and yield. A company paying 80% of earnings as dividends has little room to raise the payout. A company paying 40% has space to grow. VIG’s screening process filters for lower payout ratios and steady increases, reducing the risk of cuts. VYM includes higher payers with less growth potential but more immediate income.
- Choose dividend growth (VIG) if you want rising income over time and can accept a lower starting yield. Ideal for younger investors or those not yet needing income.
- Choose high yield (VYM, VYMI) if you need more cash today and you’re comfortable with slower growth and higher sector concentration.
- Blend both if you want current income plus some growth. A mix spreads risk and balances immediate cash with future increases.
International Vanguard Dividends: Withholding Tax and Currency Impact

VYMI exposes you to dividends from companies based outside the U.S. Two layers of complexity most domestic funds avoid. First, many countries impose a withholding tax on dividends paid to foreign investors. Common rates are 15% under tax treaties, though some countries withhold more. If a Swiss company declares a $1.00 dividend, you might receive $0.85 after withholding. U.S. investors can often claim a foreign tax credit on their federal return to recover part of that withholding. It reduces the sting but doesn’t eliminate it entirely.
Second, currency fluctuations change the dollar value of foreign dividends. VYMI holds stocks denominated in euros, yen, pounds, and other currencies. When those dividends are converted to dollars for distribution to U.S. investors, exchange rates determine how much you receive. A strong dollar means foreign income buys fewer dollars. A weak dollar boosts the dollar value of foreign payouts. Over short periods, currency swings can add or subtract a percentage point or more from your effective yield.
- Foreign withholding tax typically reduces distributions by 10–15% depending on the country and treaty.
- U.S. investors can claim a foreign tax credit on Form 1116 or use the simplified method on Form 1040 if the withheld amount is small.
- Currency volatility means your dollar-denominated distribution amount changes even if the foreign company’s local dividend stays flat.
Taxation of Vanguard Dividends and Form 1099‑DIV
Every January, Vanguard sends a Form 1099-DIV showing all distributions you received the previous year. The form breaks dividends into qualified and nonqualified (ordinary) categories. Qualified dividends meet IRS holding-period requirements (generally more than 60 days around the ex-dividend date) and come from U.S. corporations or certain foreign companies with tax treaties. Qualified dividends are taxed at long-term capital gains rates. 0%, 15%, or 20% depending on your total taxable income. Often much lower than ordinary income tax rates.
Nonqualified dividends are taxed at your ordinary income rate, same as wages. Short-term holdings, certain foreign dividends, and distributions from REITs or master limited partnerships often fall into this bucket. The 1099-DIV also reports any foreign taxes withheld. You can use that to claim a credit or deduction on your federal return. If you hold VYMI or other international funds, expect to see a number in the foreign tax paid box.
Vanguard ETFs are structured for tax efficiency. The in-kind creation and redemption process used by ETFs minimizes capital gains distributions compared to mutual funds. Still, dividends themselves are taxable in the year you receive them, whether you reinvest or take cash. Holding dividend funds in tax-advantaged accounts like IRAs or 401(k)s defers all taxes until withdrawal. Roth accounts shelter income entirely if you follow the rules.
| Dividend Type | Tax Rate | Notes |
|---|---|---|
| Qualified | 0%, 15%, or 20% (capital gains rates) | Must meet holding period; most U.S. corporate dividends qualify |
| Nonqualified (ordinary) | Ordinary income rate (10%–37%) | Short-term holdings, some foreign dividends, REIT distributions |
| Foreign-withheld | Withheld at source (often 10–15%) | Reported on 1099-DIV; claim foreign tax credit to recover part |
Vanguard Dividend Reinvestment Options (DRIP)

Dividend reinvestment plans (DRIPs) automatically use your distributions to buy more shares of the same ETF on the payable date. Vanguard offers DRIP enrollment at no extra cost, and most brokers do the same. When a distribution is paid, the dollar amount buys as many shares as possible at the market price that day, including fractional shares. If your $50 distribution buys 1.234 shares at $40.50 each, you own 1.234 more shares. Over time, those additional shares generate their own dividends, compounding your income stream without any action on your part.
Reinvesting increases your cost basis. Each new share purchased through DRIP has its own cost basis equal to the price on that payable date. This matters when you eventually sell. Higher cost basis reduces your taxable capital gain. Keeping records is important, though most brokers track this automatically. In taxable accounts, you owe tax on the dividend income in the year it is paid, even if you reinvest every dollar and never see cash.
- DRIP compounds income by automatically buying more shares with each distribution.
- Fractional shares let you reinvest the full dollar amount, not just whole-share increments.
- Cost basis increases with each reinvestment, lowering future taxable gains when you sell.
- Reinvestment makes sense for long-term growth if you don’t need the cash today. Take cash if you rely on distributions for living expenses.
Sector and Holdings Exposure in Vanguard Dividend ETFs
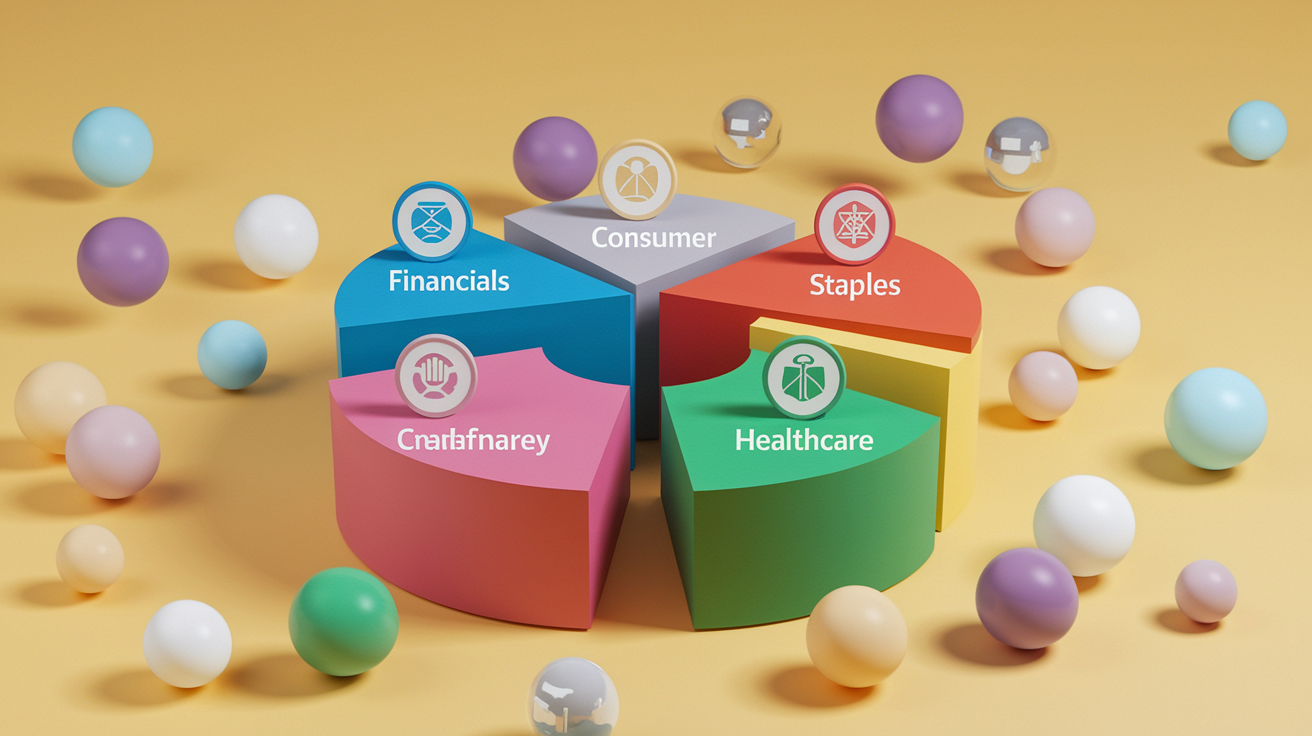
VYM’s portfolio tilts toward sectors that traditionally pay higher dividends: financials, consumer staples, healthcare, and energy. Banks and insurers often have steady cash flows and return capital to shareholders via dividends. Consumer staples companies (think food, household products) generate reliable demand and stable earnings, supporting consistent payouts. Energy companies can offer high yields, but those dividends fluctuate with oil and gas prices. Heavy exposure to financials and energy means VYM’s income stream can swing when those sectors face headwinds.
VIG favors industrials and consumer discretionary alongside healthcare and technology. The fund’s dividend-growth screen filters for companies raising payouts, which skews the portfolio toward businesses with pricing power and expanding markets. Sector concentration is lower in VIG compared to VYM, spreading risk across more industries. Lower turnover also characterizes VIG, since companies that consistently grow dividends tend to stay in the portfolio longer. VYM and VYMI rebalance more frequently as they track yield rankings, which shift with market prices.
- Financials and energy can drive higher yields but add volatility tied to interest rates and commodity prices.
- Consumer staples and healthcare provide steadier dividends with lower growth but more reliability through economic cycles.
- Sector concentration risk means a downturn in one or two sectors can sharply reduce distributions or total return.
Building a Vanguard Dividend Income Portfolio
A conservative income portfolio balances dividend stocks with short-term bonds or cash to reduce volatility. One example: 40% VIG, 40% short-duration bonds, and 20% VYM. The VIG stake provides dividend growth over time, bonds deliver stable interest income, and VYM adds current yield. Approximate blended yield sits around 1.5–2.5%, depending on bond yields and exact ETF prices. This mix suits retirees who want income but can’t stomach large swings in portfolio value. The bond cushion absorbs equity downturns, and VIG’s dividend growth protects purchasing power against inflation.
A balanced income and growth portfolio increases equity exposure while maintaining diversification. Example: 40% VIG, 30% VYM, 20% VYMI, and 10% investment-grade bonds. Blended yield runs roughly 2.0–3.2%, higher than the conservative mix. The international slice (VYMI) adds geographic diversification and boosts yield, though it introduces currency and withholding-tax complexity. Bonds still provide a safety net, but the heavier equity tilt means more price volatility in exchange for better long-term growth potential. This allocation works for investors in their 50s or early 60s who still have a decade or more before needing the full portfolio for living expenses.
An income-focused portfolio maximizes current cash flow by weighting high-yield funds heavily. Example: 50% VYM, 30% VYMI, 20% dividend-growth or REIT exposure. Expected blended yield tops 3.0–4.0% or more, depending on market conditions. This setup delivers substantial quarterly income but sacrifices some growth and increases concentration risk. Retirees already drawing income may find this appealing, especially if they pair it with Social Security or a pension. The tradeoff is higher sensitivity to sector downturns and slower dividend growth over time.
| Portfolio Type | Allocation Summary | Approx. Yield |
|---|---|---|
| Conservative income | 40% VIG, 40% short bonds, 20% VYM | ~1.5–2.5% |
| Balanced income/growth | 40% VIG, 30% VYM, 20% VYMI, 10% bonds | ~2.0–3.2% |
| Income-focused | 50% VYM, 30% VYMI, 20% dividend-growth or REITs | ~3.0–4.0%+ |
Risks and Pitfalls of Vanguard Dividend Investing
High dividend yields can signal risk rather than opportunity. A 6% yield might look attractive until you realize the company’s earnings are falling and the payout is unsustainable. Yield chasing (buying funds or stocks solely because the yield is high) often leads to concentration in struggling sectors like energy during a downturn or financials during a credit crunch. When those dividends get cut, both income and share price drop together. VYM and VYMI, with their focus on high current yield, carry more concentration risk than VIG.
Interest rates affect dividend funds, especially those heavy in utilities, REITs, and financials. When rates rise, bond yields become more attractive. Income-focused investors rotate out of dividend stocks into bonds. Higher borrowing costs also pressure companies that rely on debt, squeezing profit margins and dividend coverage. Conversely, falling rates tend to boost dividend-stock prices as investors search for yield. Rate sensitivity is highest in high-yield portfolios and lowest in dividend-growth portfolios, since growing dividends can offset rate-driven price declines over time.
- Dividend cuts during recessions or sector stress can eliminate income and crater share prices simultaneously.
- Concentration in one or two sectors magnifies losses when those industries face headwinds (energy in 2015–2016, financials in 2008).
- Currency and foreign withholding risk reduce effective yield and introduce volatility in international dividend funds like VYMI.
- Yield traps occur when a high yield reflects a falling stock price and an unsustainable payout ratio, not a bargain opportunity.
Monitoring Vanguard Dividends: Key Metrics and Tools
Track both SEC yield and trailing twelve-month yield every quarter. SEC yield gives you a forward-looking snapshot, useful for comparing funds or spotting sudden changes. Trailing yield shows actual cash delivered, which matters more for budgeting income. Compare the two numbers over time. If trailing yield consistently exceeds SEC yield, distributions may be unsustainable or include return of capital. If SEC yield is rising while trailing yield lags, recent portfolio changes may lift future income.
Dividend CAGR (compound annual growth rate) over five or ten years reveals whether the fund’s income stream is keeping pace with inflation and your spending needs. VIG’s roughly 6–8% historical dividend CAGR means income roughly doubles every nine to twelve years. VYM’s roughly 3–5% CAGR offers slower growth but higher starting cash. Check sector concentration and top ten holdings annually. If one sector jumps from 20% to 35% of the portfolio, you have more risk tied to that industry’s fortunes. Payout ratios of the largest holdings signal dividend safety: ratios above 80% leave little room for increases or mistakes.
- SEC yield and trailing twelve-month yield comparison catches changes in income sustainability.
- Dividend CAGR over five or ten years shows whether income is growing faster than inflation.
- Sector concentration shifts warn of rising risk in a single industry.
- Payout ratios for top holdings indicate dividend safety (lower is safer, higher is riskier).
- Foreign withholding trends in VYMI or similar funds affect after-tax income. Track the foreign-tax-paid line on your 1099-DIV each year.
Final Words
You saw the top Vanguard dividend ETFs—VYM, VIG, VYMI—their yields, fees, and what each fund is for.
You learned how distributions work, the main yield measures, tax and foreign withholding basics, and the tradeoffs between dividend growth and high yield.
Check ex-dividend dates, watch sector weightings, and remember taxes affect what you keep.
Now the simple next step: pick a mix that fits your time horizon, choose reinvest or cash, and set a steady contribution you can keep up.
With a clear plan, vanguard dividends can add steady income and calm to your long-term portfolio.
FAQ
Q: Do Vanguard pay dividends? Is Vanguard good for dividends?
A: Vanguard pays dividends and is a solid option for dividend investors. Many Vanguard ETFs and mutual funds pay quarterly dividends; suitability depends on your income needs, tax situation, and tolerance for risk.
Q: What is the best Vanguard dividend fund?
A: The best Vanguard dividend fund depends on your goal. For higher current income pick VYM, for dividend growth pick VIG, and for global income pick VYMI. Consider yield, taxes, and volatility.
Q: What ETF has 12% yield?
A: An ETF with a 12% yield is rare and usually risky. Funds hitting that level often use leverage, concentrate in high-risk sectors, or are closed-end vehicles, increasing chance of dividend cuts or big price swings.

